WORKING WITH G.I.S.
Understanding water as a tool forming the heritage
The Introduction to GIS lecture and the the two support workshops (working with GIS, and Understanding Water as a tool for forming heritage), offered Triplex Confinium students with theoretical knowledge as well as practical competence in mapping the competition site. The tested tools and mapping methodologies will set the basis for our enhanced GIS course.
LECTURE: Understanding GIS
Geographical information system (GIS) is a type of information system consisting of computer hardware and software, (geo)database and users, which is used to enter, store, manipulate, analyze and retrieve geographic (geospatial) data in order to solve various problems. Today GIS helps many users in various fields: urban planning, environmental management, transport, demography, public administration, business, etc.The key components of GIS include software and hardware, geographic data (geodatabase) that is analyzed with the help of particular methods and users.
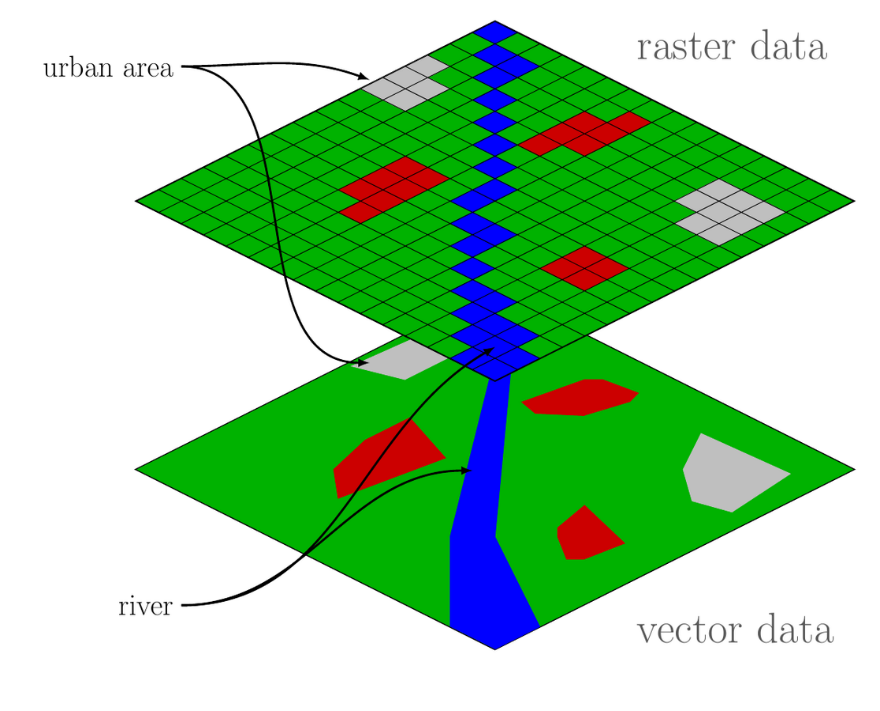
The computer system consists of hardware and software components, which are used to perform the functions of collecting, processing, analyzing, modeling and retrieving information. Sources of geographical (geospatial) data include digitalized maps, aerial photographs and satellite images, statistical tables and other documents that can be converted into a compute system readable information. Geographic data are organized in a special way in geographic databases (GIS databases). They include both geometric (X and Y coordinates) and attributive (or thematic) data about real-world objects. With the help of geometric data, real-world objects are presented in GIS in two types of formats: vector or raster. Vector data consists of three elements – a point, a line and a polygon. Raster data consists of pixels that represent cells in the raster grid .
Figure 1 Vector and raster data in GIS (www.eo4geo.eu)
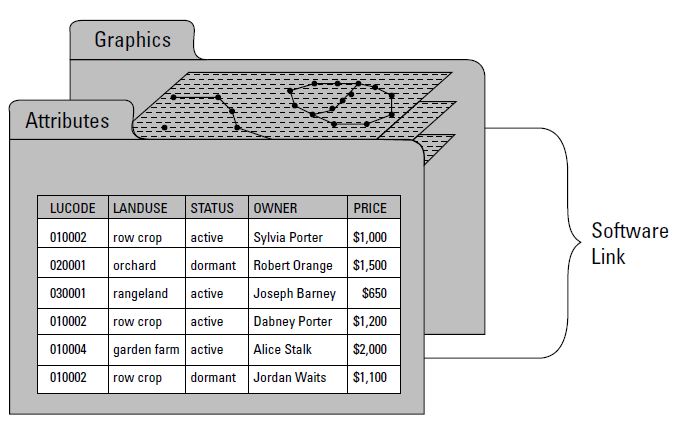
Geometric data characterize the location (coordinates), topology (spatial relationships), size, shape, and orientation of objects in space. Attributive or thematic data describe the properties (qualities) of objects and phenomena. The attribute data for the objects are stored in tabular form in the so-called “Attribute tables”. The geometric and attributive data for each object are interconnected in the geographic database. This means that geographic objects can be identified and localized using their attributes, and vice versa (fig.2).
Figure 2 Geographic and attribute data in a GIS (De Mers, 2009)
The role of users is to select, update and analyze the information in GIS that interests them to solve a particular problem. The term “user” refers both to the individual specialist working in the field of GIS and to organizations (government, non-governmental, educational and corporate) whose mission is in some way related to GIS.
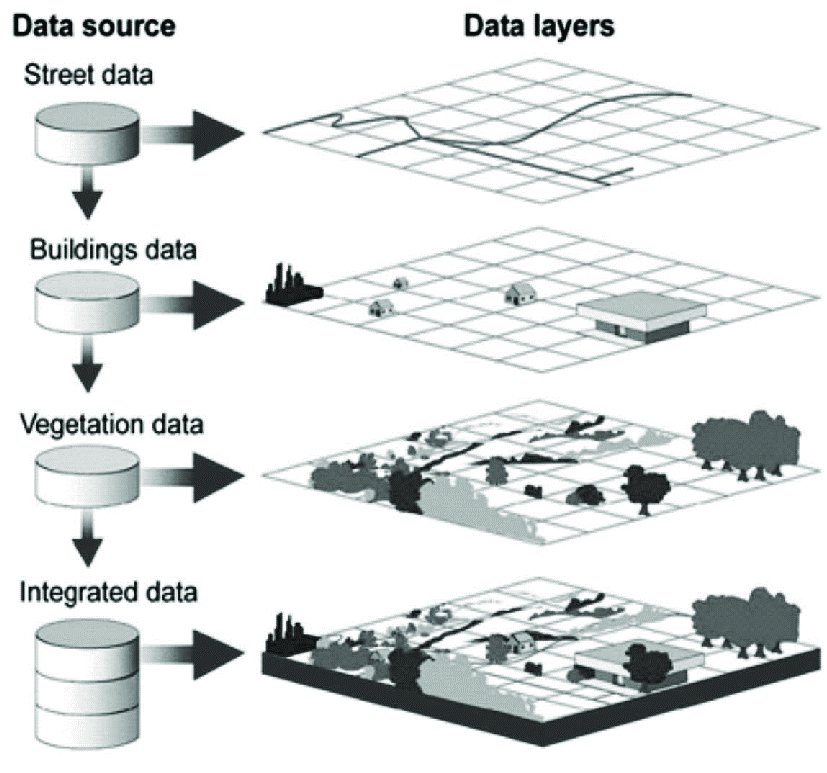
In order to visualize the real world GIS specialists use digital models. Digital maps and attributive information (databases) are used to represent the real world in GIS. The organizational structure of those maps are based on layered organization of GIS data. Each model of reality is a separate layer, representing individual objects such as streets, plots, infrastructure etc. Each layer contains geometric (coordinate) data and related attributes, organized in a special way in an attribute table (fig. 3).
Figure 3 GIS layers (Parida et al., 2019)
For a given area, multiple layers can be combined and the connections between objects in the individual layers can be revealed. In reality, even in a small area, there are an infinite number of objects and the description of all of them will require an infinitely large database and an infinite number of layers. Since we do not have the necessary resources (time, computer memory, etc.), we create a digital model only for those objects and phenomena that interest us (the so-called “Target GIS”). This model does not cover all the diversity in the real world. Therefore, when creating the digital model we use classification and abstraction. In classification, we group similar objects and phenomena into separate classes / layers. In abstraction we make a selection of objects and phenomena and their characteristics in accordance with the goal and choose the model by which to present them in GIS.
The representation of a territory as a combination of layers is an abstraction (e.g. Jimbolia region as a “sandwich” of layers “relief”, “water bodies”, “soils”, etc.). Separate layers can be created for “streets”, “buildings”, “museums”, “addresses” which together (in combination) represent a model of reality.
There are relationships between the attributes in these layers – the addresses are related to the streets and the buildings to the addresses. The buildings have owners, built-up and developed area, floors, type of construction and other attributes; the streets are one-way or two-way, have restrictions on speed, type of pavement and other attributes.
When we obtain the computer system and our geodata we can proceed to perform a spatial analysis in order to solve the real-world existing problem. For that we can use different questions:
- Localization questions: What’s in …? (what is in a certain place);
- Conditional questions: Where is the object N with coordinates X, Y and Z? (which locations certainly meet the set conditions);
- Trend detection questions: How is changing …? (identification of geographical objects and phenomena that have changed or are in the process of change);
- Relational questions: What is the connection between …? (the spatial interrelations between the objects and their characteristics in space and time are analyzed);
- Modeling questions: What if …? (finding the optimal path, in a suitable territory for some activity or in territories with increased risk on the basis of a previously created model).
The final step in the decision-making stage. GIS provides useful information to decision-makers through analysis and evaluation of the geographical database. Decision-making is an important area of public practice, including policy making, planning and management. Decision-making is based on the expert knowledge of the problem to be solved and the availability of the necessary initial information.
text: Kaloyan Tsvetkov
References:
Harmon, J. & S. Anderson (2003). The Design and Implementation of Geographic Information Systems. John Wiley & Sons.
DeMers, M. (2009). GIS For Dummies. Wiley Publishing, Inc.
Parida, P., A. Sahoo and B. Mohanty (2019). GIS applications in fish disease mapping and forecasting. In: Advances in Fish Research, Vol.-VII, Pages 355–369 Edited by: B.P. Mohant. Narendra Publishing House, Delhi, India.
http://www.eo4geo.eu/training/urban-heat-islands-basic-gis-knowledge-vector-and-raster-data/
WORKSHOP: Understanding water as a tool forming the heritage
Tutors: Bogdan Demetrescu, Mihai Danciu (FAUT)
Students: Lucia Bolojan, Mihaela Petrova, Boris Gluščević
The workshop aimed to provide an understanding of the local cultural landscape using two complementary methods: exploration (subjective approach) and mapping (objective approach). At the end, they were brought together in an explanatory material that presents the relationship between natural and anthropic (re) natural heritage, associating various situations identified at eye level with the potential for continuity of the major network of natural and built heritage. The hypothesis launched by this workshop was that there are two types of blue green elements (lakes – former clay mines and drainage canals) that are fragmented by communication or municipal infrastructure. In this sense, the mapping had to propose at the end an area where intervention is needed to restore the continuity of this (re) natural green-blue infrastructure.
The ‘exploration’ stage initially consisted of the study of archival documents, containing systematization plans from the pre-war and communist periods, as well as land use plans for drainage and irrigation by watercourses. The role of this study was to introduce the topic and to understand the relationship between the historical evolution of the settlement and the hydrotechnical works made in various periods of time. The introduction was followed by traversing the territory along the green-blue corridors of the peri-urban area and the network of ditches and canals that form the urban system for the management of meteoric and groundwater. The northern areas of the ponds, the pumping station at the eastern end, the clogged areas between the main core and Futok, as well as the still existing canal in the entire urban perimeter were explored. Also, as a result of the interaction with the inhabitants, the participants were able to learn about the activities carried out by community members in relation to the green-blue network: in winter for recreational activities (skating, sledding), and in summer for watering animals. Last but not least, the participants identified areas where the network is clogged or unused, as well as the lack of water in certain segments.
The second part, ‘mapping’, used the basic features of a GIS software to get acquainted with the work environment. Following the introduction to the fundamental aspects of operating in a GIS software, made by the SUSKO team, the workshop participants became familiar with the working environment in QGIS. Therefore, during the FAUT workshop, they went through the necessary steps to record polygon, line and point type information on a georeferenced support prepared in advance.
The second part of the workshop took place in the House of Culture of Jimbolia and involved mapping the layers extracted from the satellite map and those identified during the site visit.
The exercise involved mapping all the elements identified in the exploration taken in the two days before, primarily through basic elements: the hydrotechnical network, recreational and leisure areas, brownfields, industrial functions that pollute / do not pollute watercourses, natural landscape landmarks and built heritage landmarks. Following their registration, the following steps involved a network analysis, which resulted in the following types of information: conflicts between the green-blue system and the mobility infrastructure, the green-blue extra-urban corridor developed between the brownfields and the of agricultural crops, the green urban corridor developed within the limits of the buildable area, the territory in need of protection which sums up the two types of corridors listed above and the relevant built heritage over a distance of 100 meters outside the natural area.
Figure 04 a, b, c: Result plans
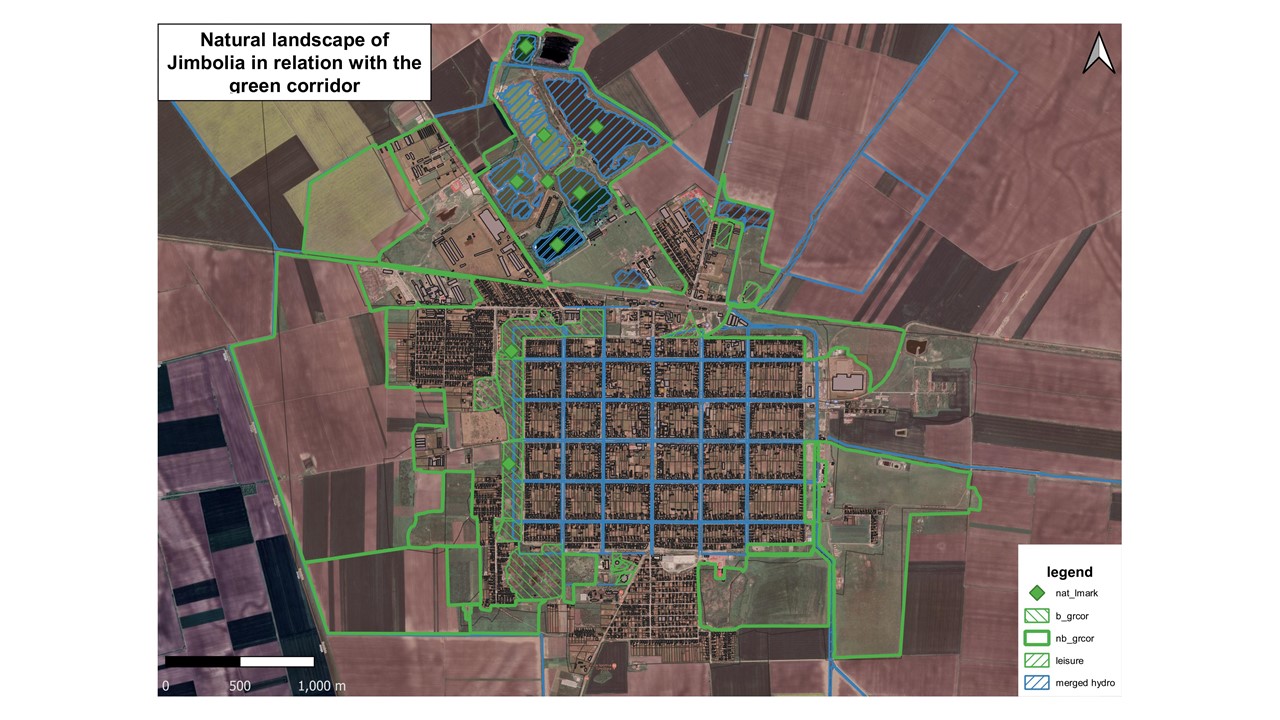
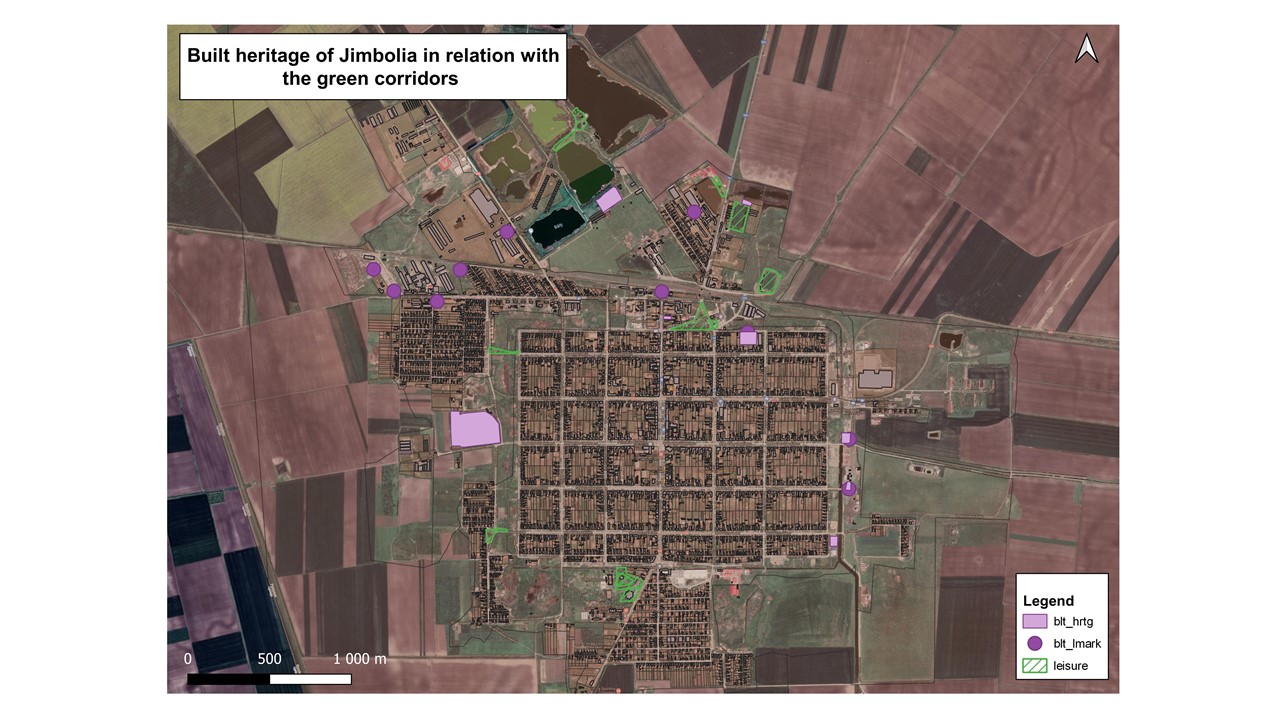
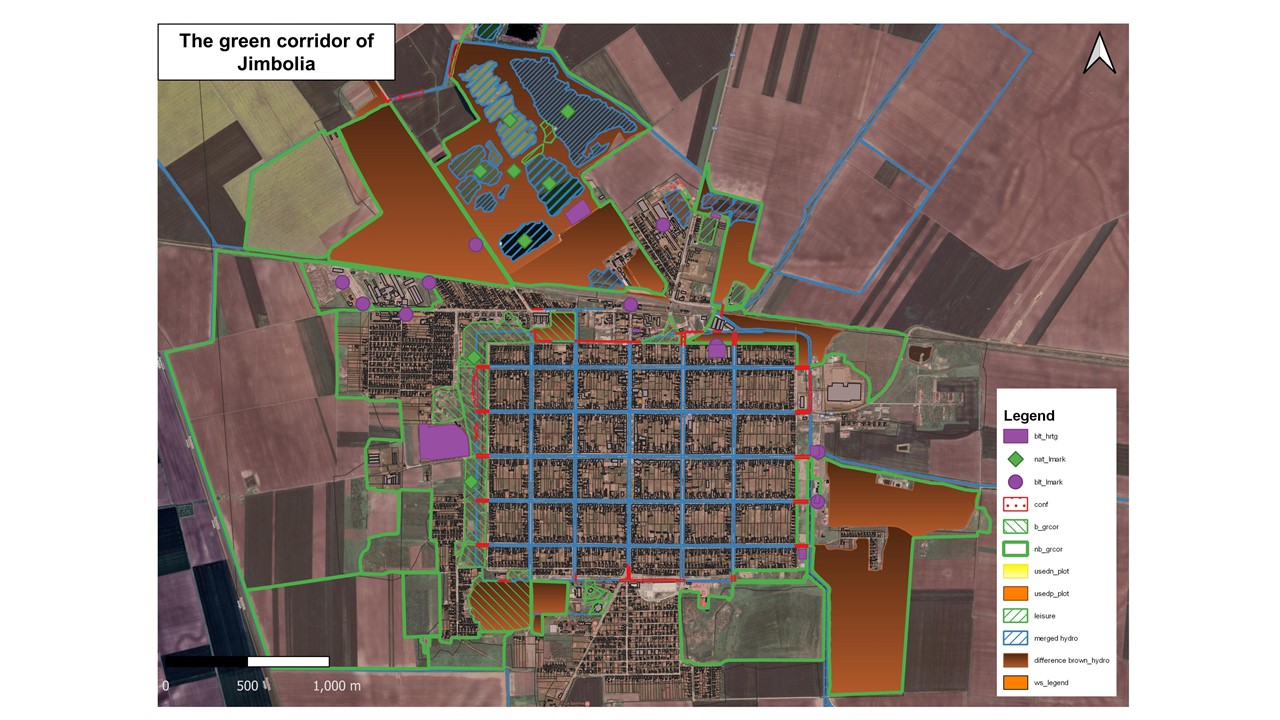
The resulting plans contain relevant information on Jimbolia’s heritage, both from the perspective of valuable natural elements and those of built heritage. The result shows that an external and an internal green belt are formed, which allow the communication between the pond area and the major network of drainage channels. The identified conflicts must be addressed through punctual, concrete measures, establishing ways of intervention according to the punctual dysfunctions.
The results showed that the situation in the first place suffers in terms of poor administration, although there is a continuous network that has the potential for continuity. The landscape is closely related both to heritage objectives built from various periods, and to daily activities of the community that have become a habit. The conclusions express the need to ensure this continuity of the green-blue network, integrated with that of the public spaces of the city and with that of recreation for the inhabitants of Jimbolia, a true double green belt of the locality.
text: Mihai Danciu