
O1.M2.05. Digital Mapping – Current uses of Photogrammetry in architecture projects
Free
About this course
Chapter 1. Architecture as spatial art and science
Architectural space can be described as a series of codes, parameters and philological relations that are established between material components, which they in turn, are defined by physical properties. We live in a material world with spiritual aspirations. The material world is the physical image through which the artistic and aesthetic qualities of architecture are communicated, received, interpreted, and evaluated both in a spiritual and positivist sense (Zevi, 1948).
In the physical plane, architectural objects are defined by spatial elements having physical and quantifiable properties such as: shape, volume, dimensions (on 3 axes), surface, texture, color, state (liquid, solid or gaseous), transparency, weight, viscosity, etc. As a sensory experience, the perception of these constructive elements is instantaneous and kinesthetic. In Bachelard’s words: “architecture is a polyphony of the senses” (Bachelard, 1971). Professionals need to approach this complex situation with a clear mind. As it often happens in restoration projects, the situation one can find himself in is contradictory and counterintuitive in nature, sometimes having a hermetic character regarding the hidden messages it contains.
The first surveys predate the sedentary, agriculture-orientated civilization. The oldest discovered maps in the world are found in Spain, are over 13,000 years old and were most likely made by hunter-gatherers scratching the walls of some cave with stones (P. Utrilla, 2009). Of course, these were visual representations of how a certain space is subjectively perceived. The oldest survey made by “professionals” is from ancient Egypt, 3,500 years ago, in the famous tomb of Menna. The team the surveyor belonged to, used the tools and methods they had at their disposal i.e.: sun-ascending angle instrument – used for angular measurements, gnomon – sundial used for defining the circumference of the earth around 240 – (Smith, 2005), metal strings, and especially the dimensions of the human body (feet, elbows, etc.).
As architectural projects became more complex, the need for control and precision of tools increased. The results of the measurements are partially limited by the tools available, rather than by the inventiveness of the users. In the 18th century, with the development of Vauban fortress defense systems (Dinu, 2018), through the intrinsic mathematical character of determining the ideal forms of defense for these fortifications, the surveying systems of both buildings and land were developed at a very high speed. Another powerful impulse from the same period was the famous rise of the Topographic Josephine Survey (1764 – 1785), which set out to map the territory of an entire empire.
With the emergence of Enlightenment, rational and scientific movements marked new waves of technological and methodological innovation. In our digital age, we have developed a certain kind of fetish for precision. In some cases, this phenomenon is perfectly justified, in others, it becomes a consequence of the desire for compensation, as a result of the general bureaucratization of all fields and the decrease of the professional quality of the labor force. However, more recent computational and software developments are beginning to allow the widespread use of advanced mapping methods and their correlation with total control tools: BIM, GIS, geodetic software. Powerful control systems allow, as never before in history, an extremely useful and precise coordination between experts and specialists in related fields when working on complex projects.
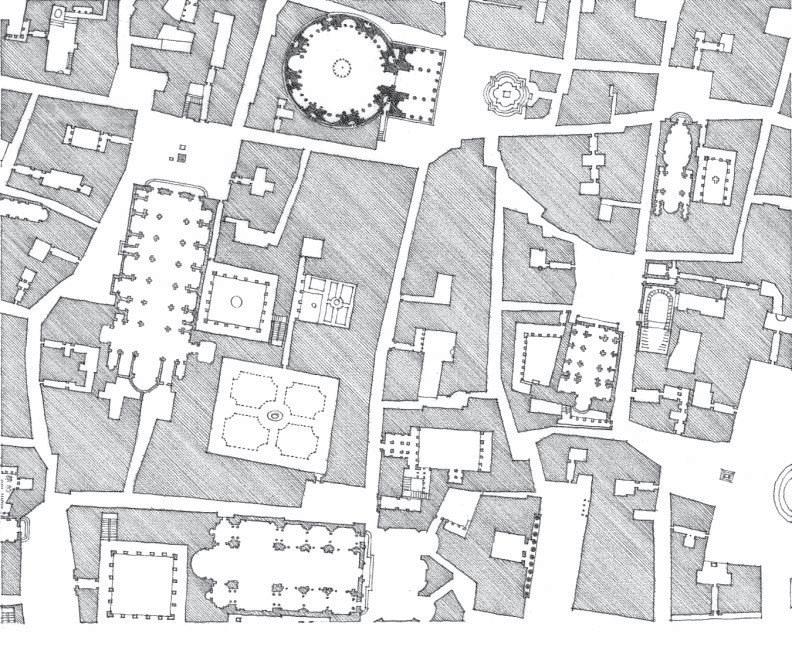
Precisely due to these ambiguous challenges and circumstances, the way we perceive, analyze, and interpret the messages contained in the architecture objects, ensembles and the landscapes impose the highest objective and rational recording of a multilayered reality. For example, in Figure 1, the relationship between positive and negative elements, mass and space, in this part of Rome, cand be perceived in an inverted way, depending on what we chose to see as a built form or empty background. Courtyards, alleys, and major open spaces can be read as positive elements against the background that is the dense built mass of the city (Ching, 1979).
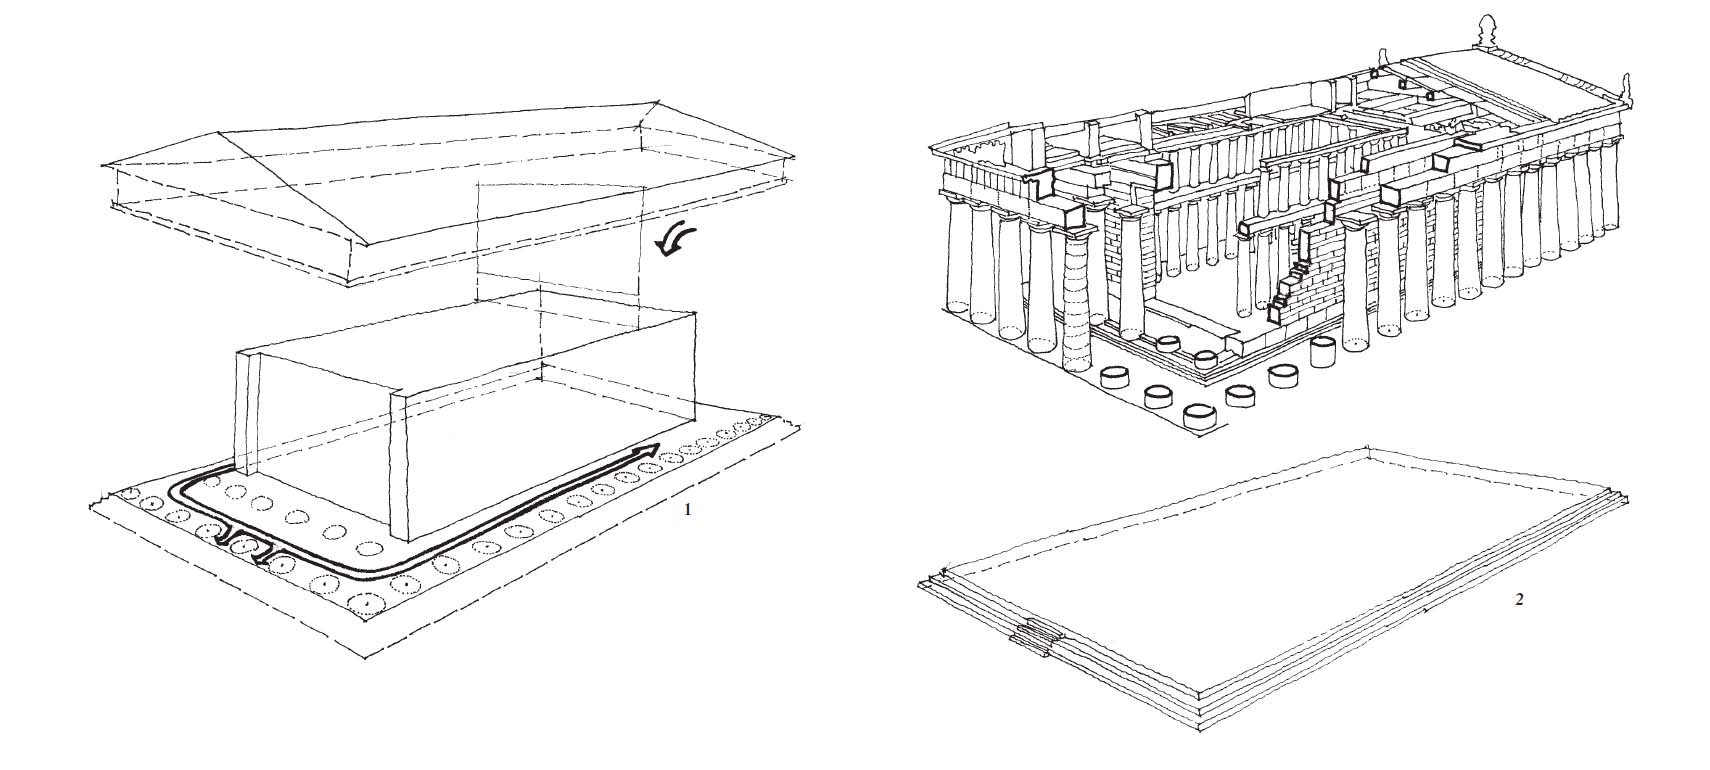
Based on the way that de message is recorded, fundamental decisions are being made regarding the way of conservation, enhancement, and intervention in a historical context, that can sometimes be saturated with information. In this process, translated in technical terms in the form of “surveys”, the way in which space is measured, redrawn, visualized and represented is defining for the design and management process – Figure 2.
The storage of information is most often done in very different forms, the means and technology chosen being correlated with the objectives and filters of the analysis. The recordings can be organized in the following forms (without presenting an exhaustive study):
-
- 2D and 3D surveys of the objects
- databases with historical and recent photographs, samples of physical materials used in the building process, etc.
- geological and geotechnical studies
- ecological studies
- degradation maps
- structural, chemical, physical, and biological analyzes
- typological studies of the architectural object
- and many more
The more precise, accurate, and well-recorded the survey, the more it can increase in value in the analysis process. Although an ideal survey will never be able to replace the professional qualities or the theoretical and technical knowledge of a specialist, a diamond-tipped tool will be able to penetrate even the most obtuse and difficult situations in which we can find ourselves during some projects. In this context, the architectural survey, the restoration surveys, and the landscape studies by their intrinsic nature require access to the most efficient methods of recording the physical reality that surrounds us.
The following course is meant for students and professionals alike. Chapters 2-4 deal with standard building and site surveying challenges, seen through 3 case-study projects. The second part of the course, Chapters 5-8, encompass the digital scanning principles that are currently being used as contemporary state-of-the art alternatives to standard surveying methods. For those who are familiar with architecture restorations projects and their specific workflow, it is recommended to start with Chapter 5.
Chapter 2. The role of surveys in architecture design process
For architects, the design process represents a series of interconnected phases, each of which plays a critical role in the success of the project. While starting phases deal with ways of the defining and fitting specific problems, following stages include data gathering and data analysis while later stages consist in conceptual and technical solutions. Architects and specialist design to find the best solutions to the multidisciplinary challenges of any given project. The discerning management of financial resources, those related to time and human resources contributes substantially to the results that can be obtained from an architectural project.
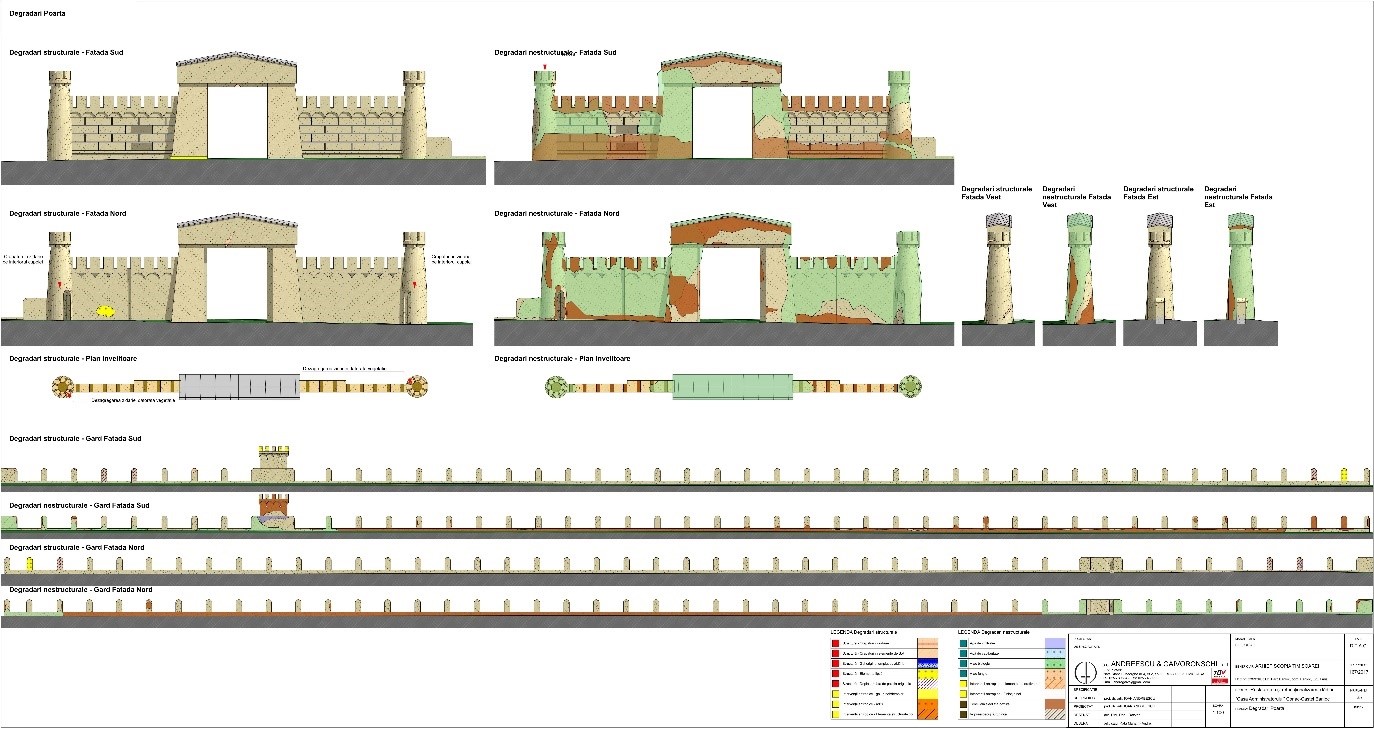
When projects include existing buildings, the survey stage plays a key role in the whole design process. The importance of this stage increases exponentially with the complexity of a building, a situation in which we often find ourselves when dealing with buildings that have a special heritage value. It is not conceivable to carry out a restoration project in the absence of a detailed survey which must have as much detailed information analyzed and organized as possible – Figure 3, Figure 4. An incomplete, incorrect, or inaccurate survey can lead to both making wrong decisions at the general strategic level and at a detailed, specific level.
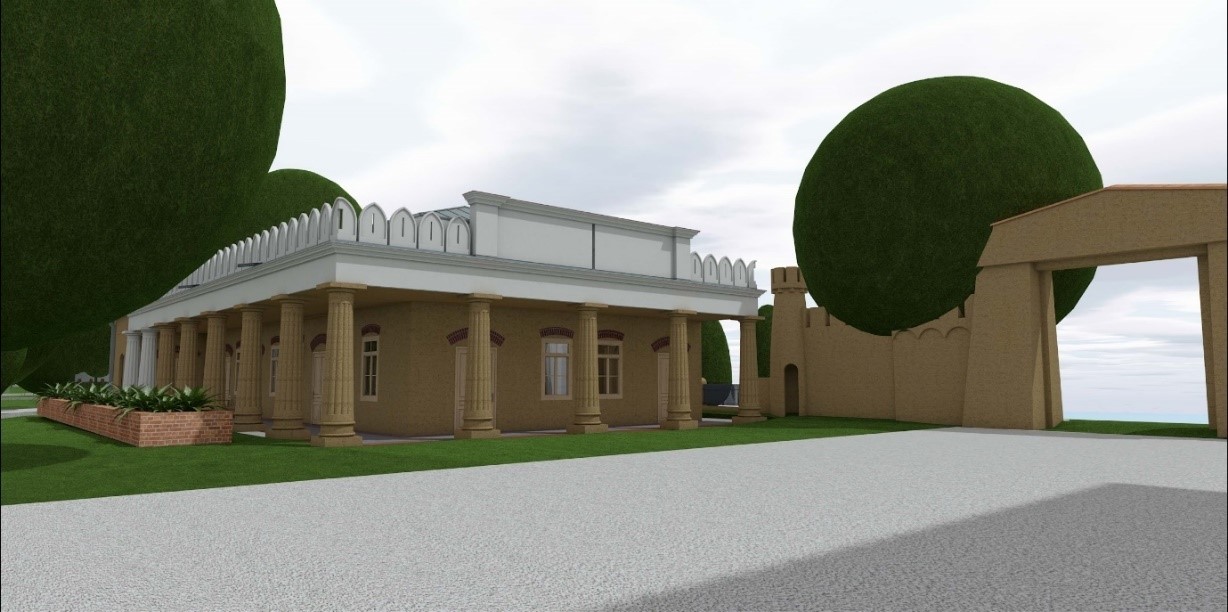
Often, the problems of an existing building are complex and interrelated with each other. Degradation can have multiple causes – biological, physical, chemical, structural, anthropic, etc. and their mere determination cannot take the place of intelligent diagnosis. Also, digital remodeling in 2D or 3D can be extremely useful if it is precise, accurate and objective – Figure 5. Creating technical drawings of facades, plans, sections and so on is useful, but it is not enough if it is not followed by a typological framing of the style of a building to determine the causes for which an architectural object took its specific form – Figure 6. The challenge of a survey is to be able to extract as much information as possible about the objective reality of a given situation, to generate a holistic image serving the restoration project. Although complex surveys can become expensive in some cases, the initial investment in a successful survey contributes to a better financial management throughout the whole project.
Chapter 3. Current practices in complex surveys (case-studies)
As previously discussed, the surveys are composed of different stages that succeed each until the desired result is obtained. It is extremely difficult and highly unlikely that a complete 3D model of an architectural object can be generated in a single measurement session. Most often the measurements are checked and rechecked after each 2D or 3D modeling stage, to eliminate possible measurement errors and to fill in the missing information. Most CAD software that are in current use (ArchiCAD, AutoCAD, Revit, Nemetschek), are developed primarily for project that involve mostly new, or recent building. Their use in restoration projects requires very good knowledge of their specific digital tools while keeping a bird’s eye view on the whole design process. By standard tools we understand tape measure, meter, telemeter, laser level, topographic survey, DSLR camera, home computer, internet, GPS; it does not include access to performant PC, cloud-computing, UAV, LIDAR, Photogrammetry techniques or software, geodesic equipment.
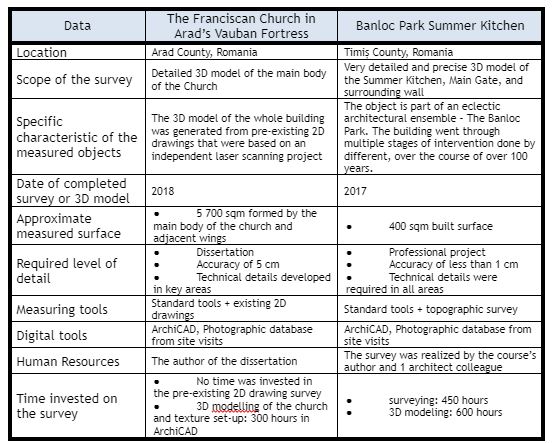
To be able to foresee what the challenges of such an undertaking are, and to be able to select their possible solutions, a comparative study is proposed on 3 architectural projects that have different levels of complexity. The author of this course was directly involved in the projects, the examples being part of the bachelor’s thesis, dissertation, and a professional restoration project. The general and contextual data of the projects are defined in Table 1. Chapters 3.1-3.2 are to detail the process of 3D survey and the 3D reconstruction of objects. Chapter 3.3 aims to frame the general limits of the detection process using standard methods and to define the types of errors that can appear during measurement and 3D modeling.
The comparative study is relevant both for students and professionals in the field of architecture conservation/restoration who want to develop creative ways to address the complex issues of heritage buildings surveying processes, and to understand the value that advanced surveying techniques (photogrammetry and laser scanning) can provide.
Chapter 3.1 The Franciscan Church in Arad’s Vauban Fortress
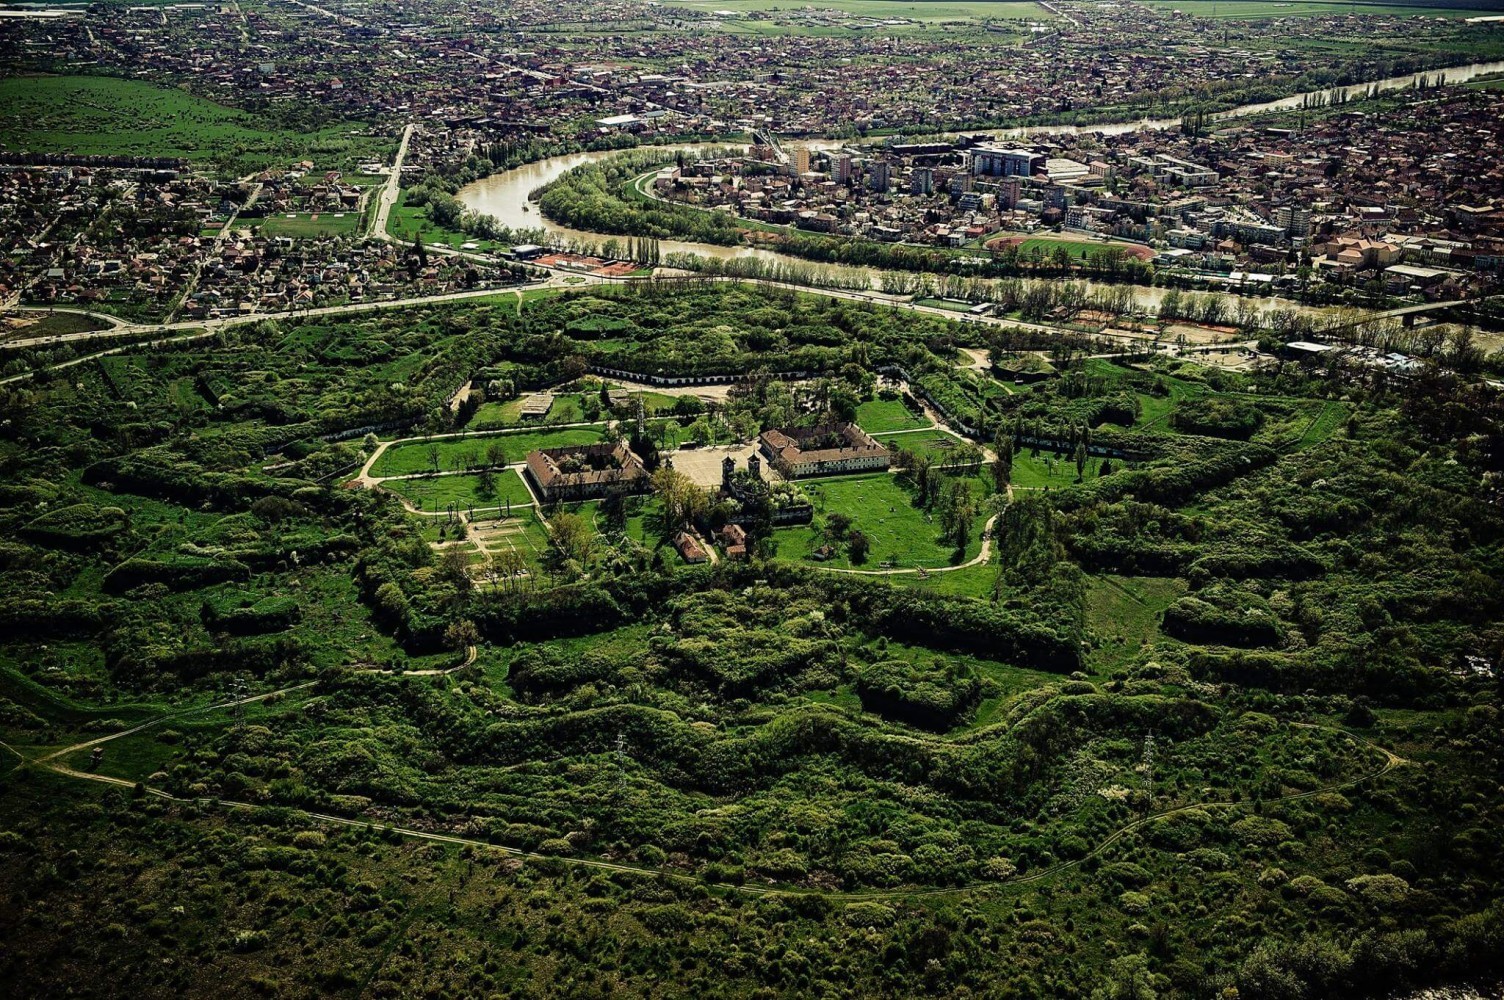
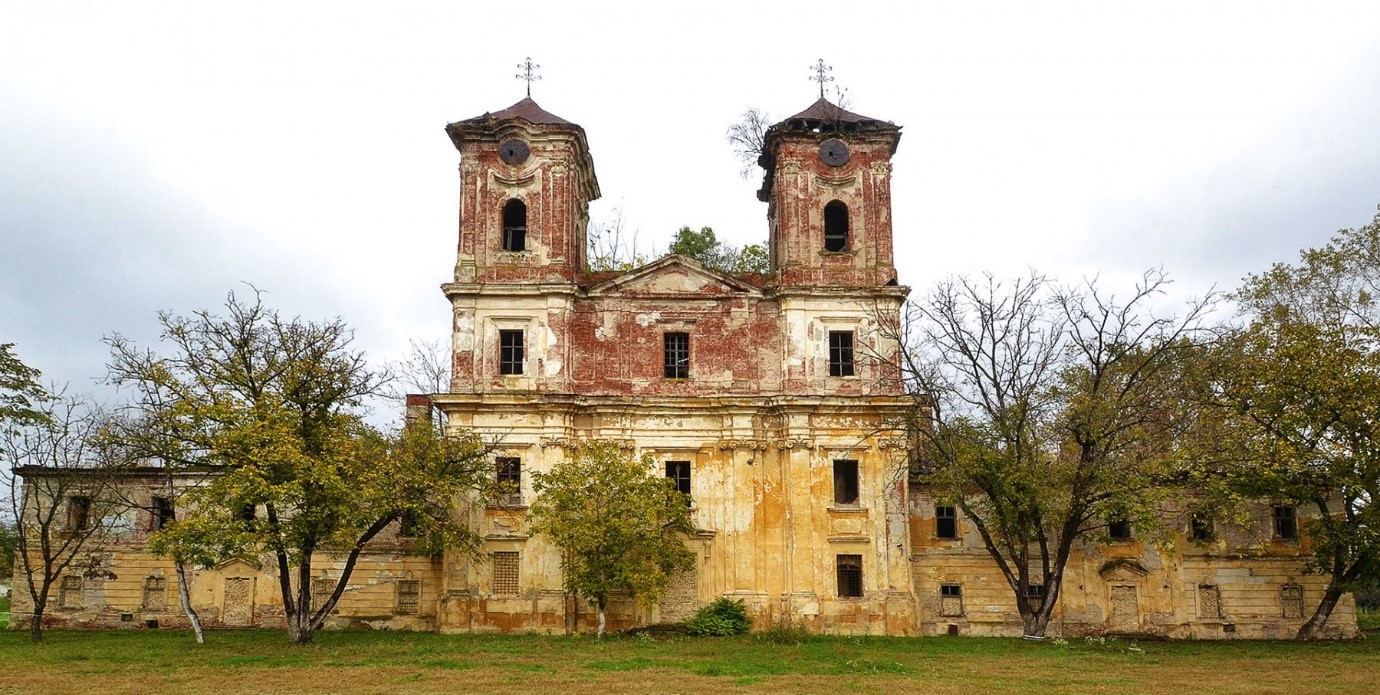
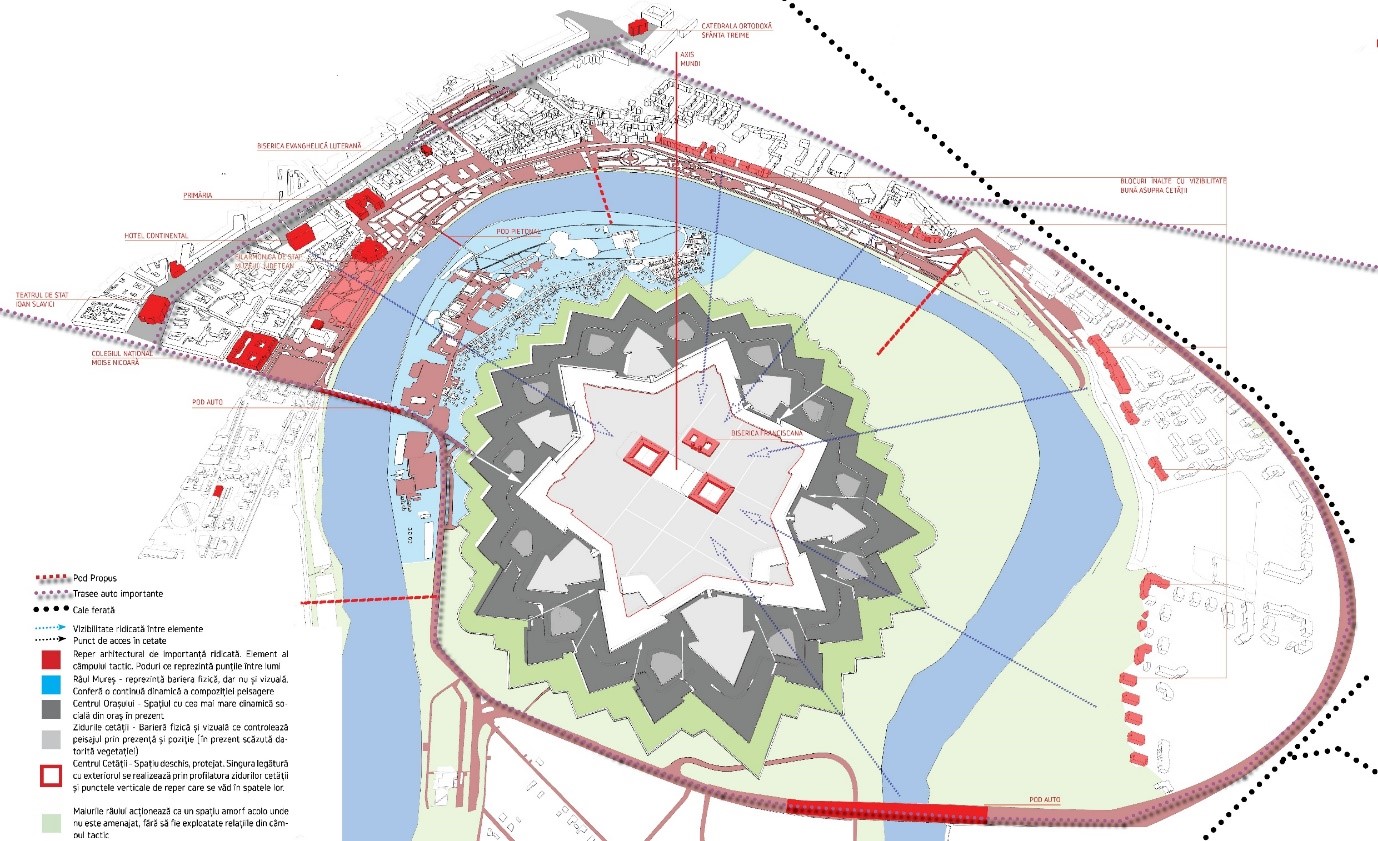
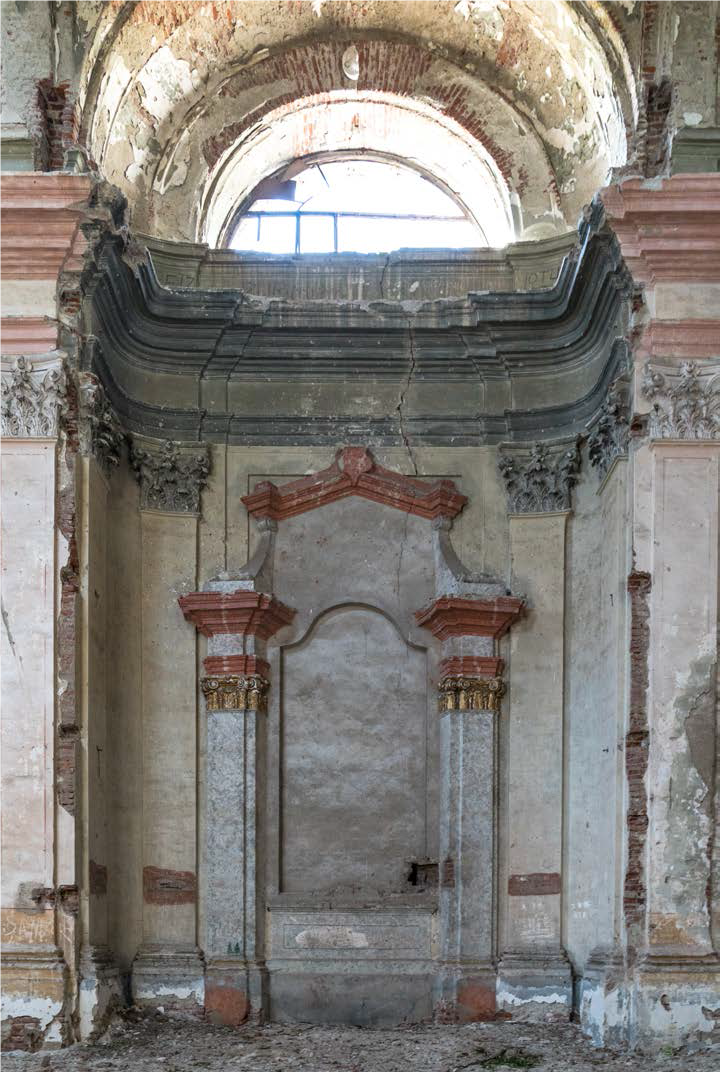
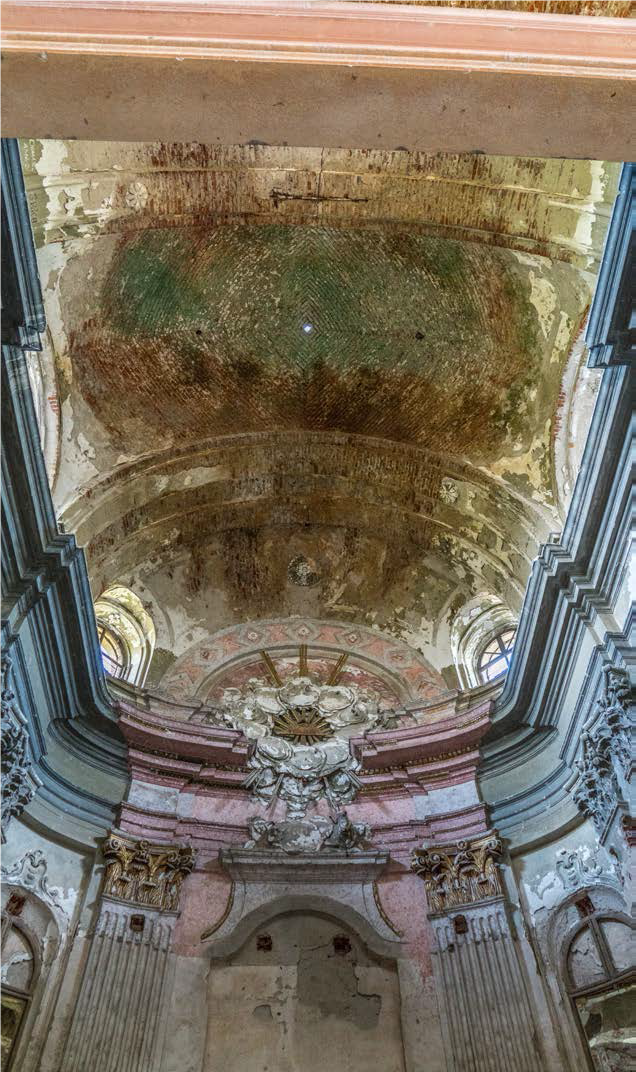
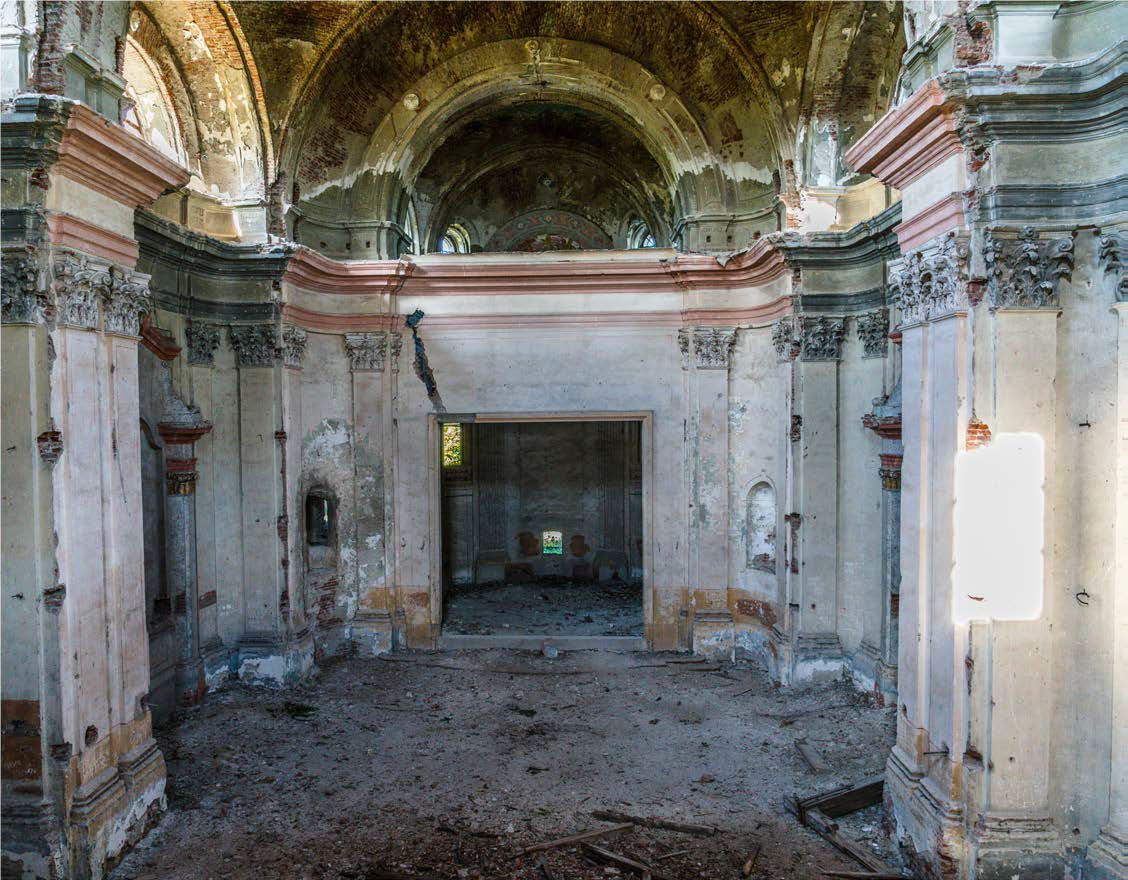
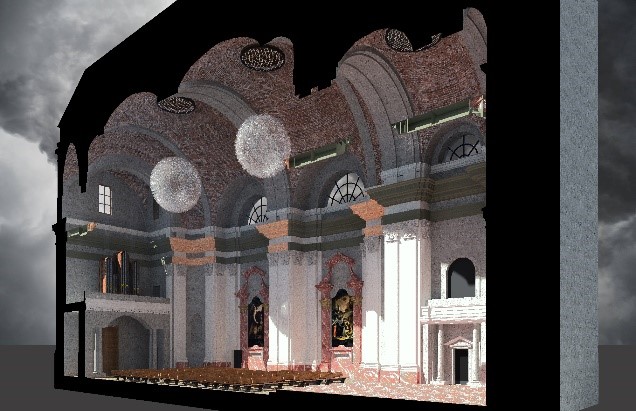
The project during the first generation of 2016-2018 of the Master of Restoration and Heritage Regeneration within the Faculty of Architecture in Timisoara, has been the development of a Masterplan for urban and heritage regeneration of the largest intact military fortification in Romania – the Vauban Fortress of Arad -Figure 7. The fortress was built in the 18th century and contains several historical buildings of very high value and importance for the city (Dinu, Varga, Pasca Daciana, & Ostrovsca, 2021). The oldest buildings were erected during the same period. Out of these objects, the Franciscan Church plays the central role for the entire historical ensemble – Figure 8. The building has remained almost intact, except the roof which is currently in a pre-collapse stage. In the Masterplan, the destination of the building, composed of the central body of the church itself and two side wings that represented the cells of the priests and a military hospital, is destined to become a multifunctional space.
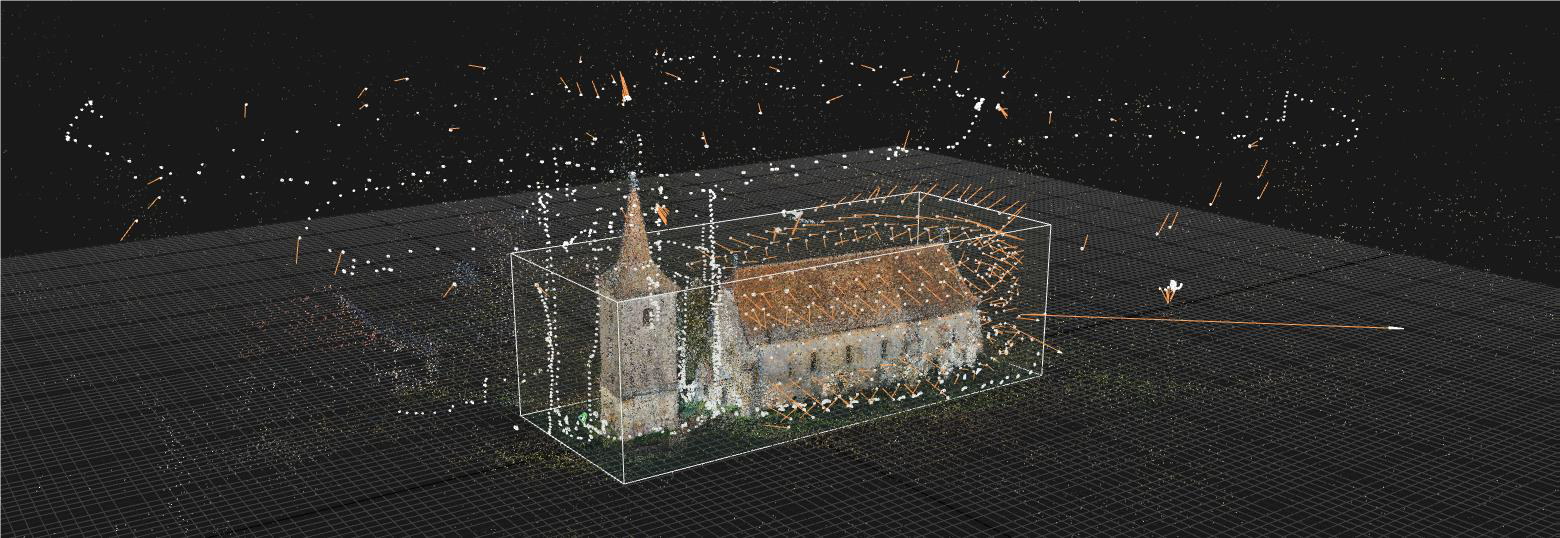
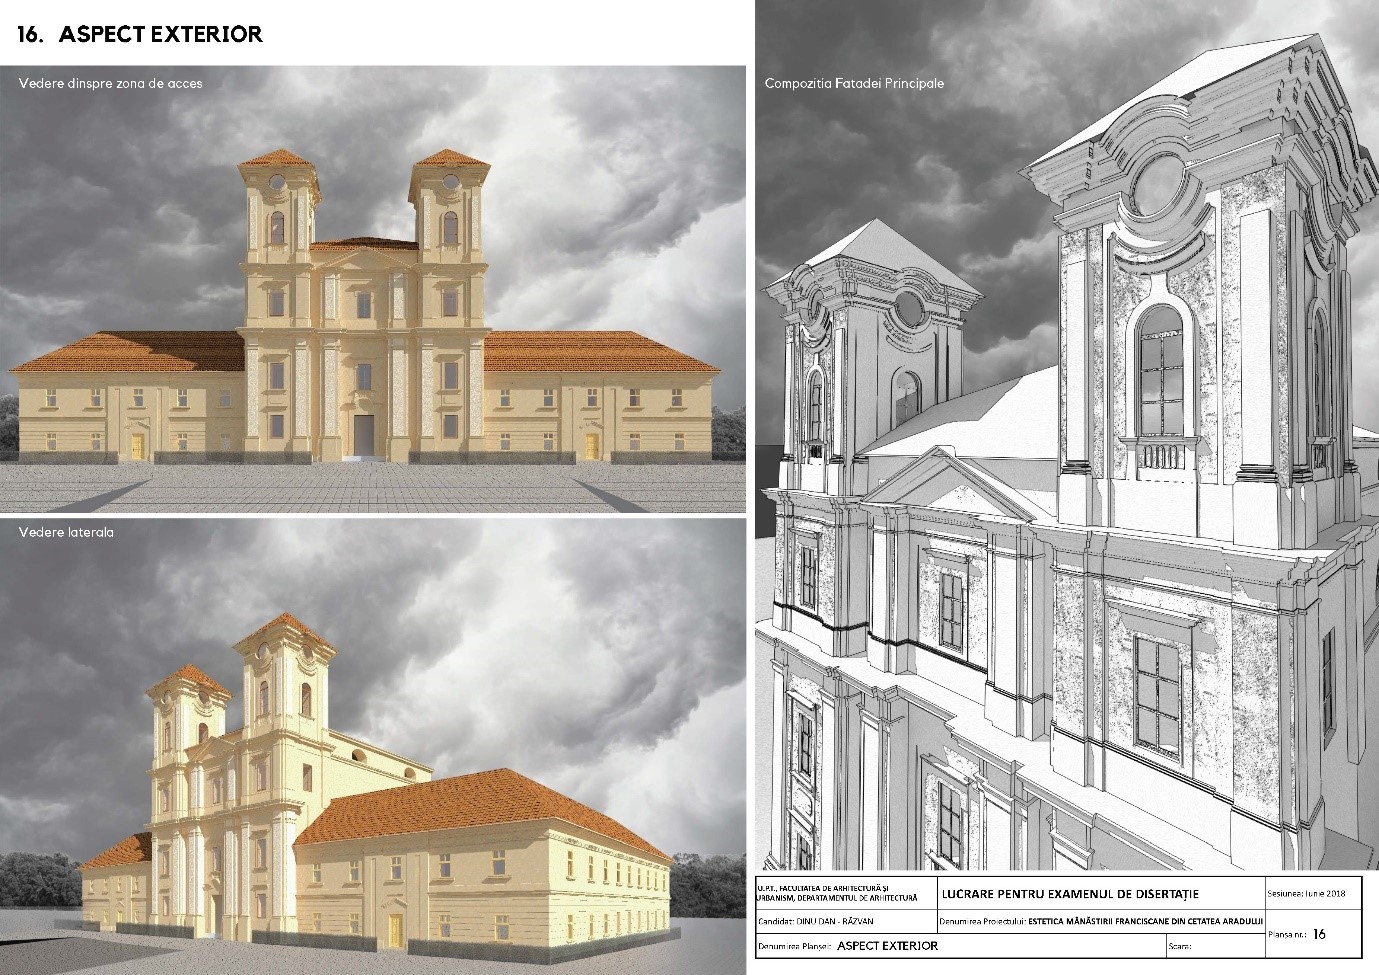
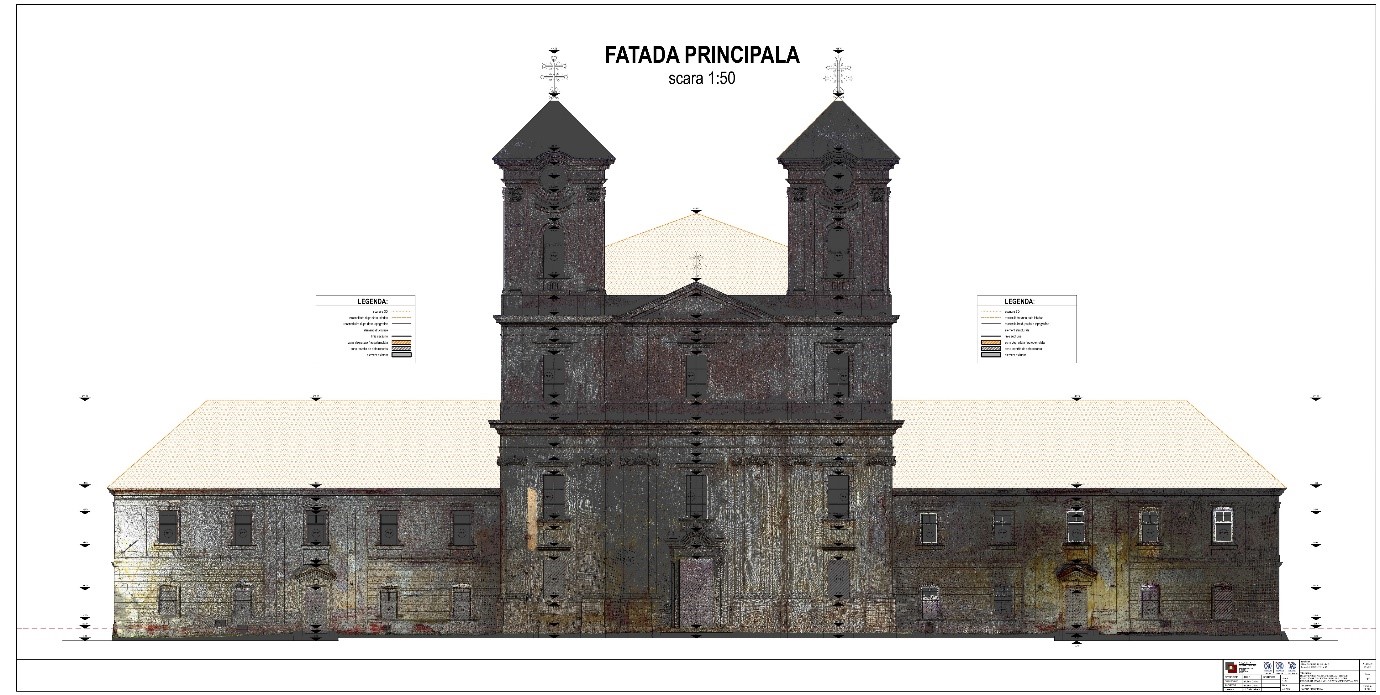
Fortunately, the on-site survey did not have to be done manually. In 2015, the laser scanning company SC STACONS SRL performed a point-cloud scan of the entire church and the inner courtyards – Figure 12. Based on the point-cloud scan, they generated a set of 2D drawings that formed the basis of the 3D reconstruction – Figure 10. As design software, ArchiCAD 21 was used, which proved to be extremely useful in most situations, as we shall see. The situation where problems could not be managed ideally were the situations in which their bas-relief or decorative elements on the facades and interior elevations that were created as sculptures or as stucco-marble (pilasters and columns, decorative elements at the altar, some window and door frames, carpentry, friezes, etc.). Unfortunately, because the Church belonged to the Vauban Fortress of Arad, which was under the care of the Ministry of Defense at that moment, site visits were relatively limited. For this reason, the 3D modeling stage was based exclusively on 2D technical drawings, and a set of limited pictures taken on site.
The method of rebuilding the church consisted in carrying out the following steps:
-
- importing and scaling of all 2D drawings based on point-cloud mapping (at that moment there was no access to the original point-cloud)
- definition of structural axes (two-way structural walls) and limestone elevations on each level
- reconstruction of a general volume over which the decorations were introduced
- reconstruction of more complex volumes (brick vaults, roof)
- reconstruction of carpentry for windows and doors
- defining some typologies of decorations (capitals, employed balusters, framing elements and altars) as well as profiles of the moldings of all the cornices (there were over 20 profiles for moldings on the face of interior elevations)
- disposition and implementation of the database with decorations in the 3D model, having as supporting plans the 2D technical drawings
- application of textures on the entire 3D model
- final verification of the entire model
Although the 3D modeling method was considered as rational as it could be, in practice, the process was very complex and sometimes frustrating. As previously mentioned, when we are dealing with historic buildings, we start from the premise that no wall, no plane, no ceiling is perfectly straight – Figure 11. The 2D survey on which the 3D reconstruction was based, and which we received, was made entirely at right angles. This “solution” greatly simplifies the process of 2D redesigning the building, and when we look at independent technical drawings, we have no way to notice a drawing error. Only by 3D reconstruction of the entire building can the possible drawing or survey errors be checked. The final model (Dinu, 2018), can be consulted in the following figures.
Chapter 3.2 Banloc Park Summer Kitchen
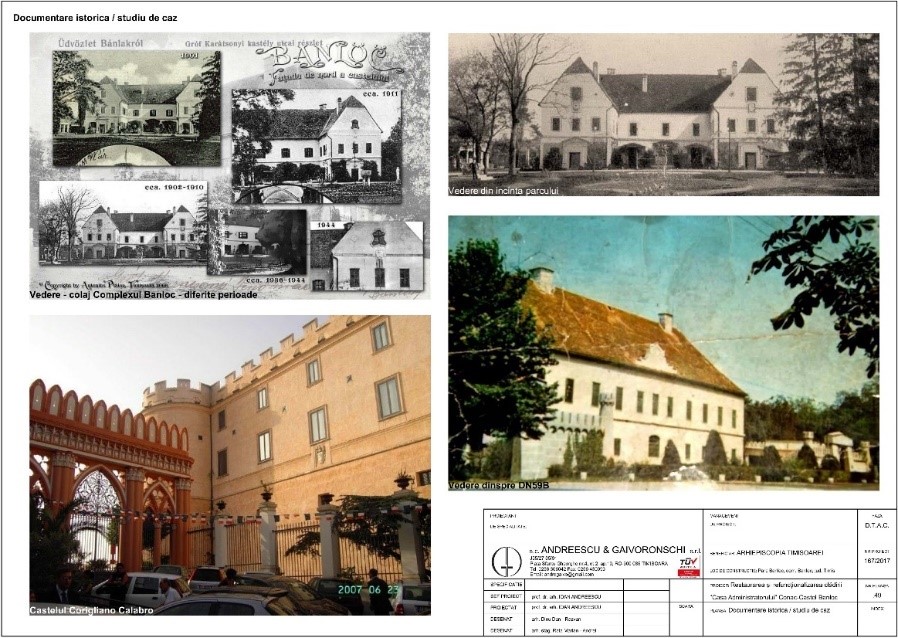
Situated in the middle of a huge fertile plain that resulted from an 18th century draining of a swamp, the small town of Banloc was the centerpiece of an important estate – Banlok (17,000 hectares) and contains the castle, park, and remains of other significant structures. The Banloc Park and Castle form a protected historical ensemble (LMI code TM-II-a-A-06177). The property was an Austrian imperial gift to the Croatian governor (ban) Draskovich (1750). It was sold to a wealthy family of Armenian descent – Karacsony’s; this family finished the castle in 1793 and later its heir, the Egyptologist Eugen Karacsony, remodeled the park in the first half of the 19th century.
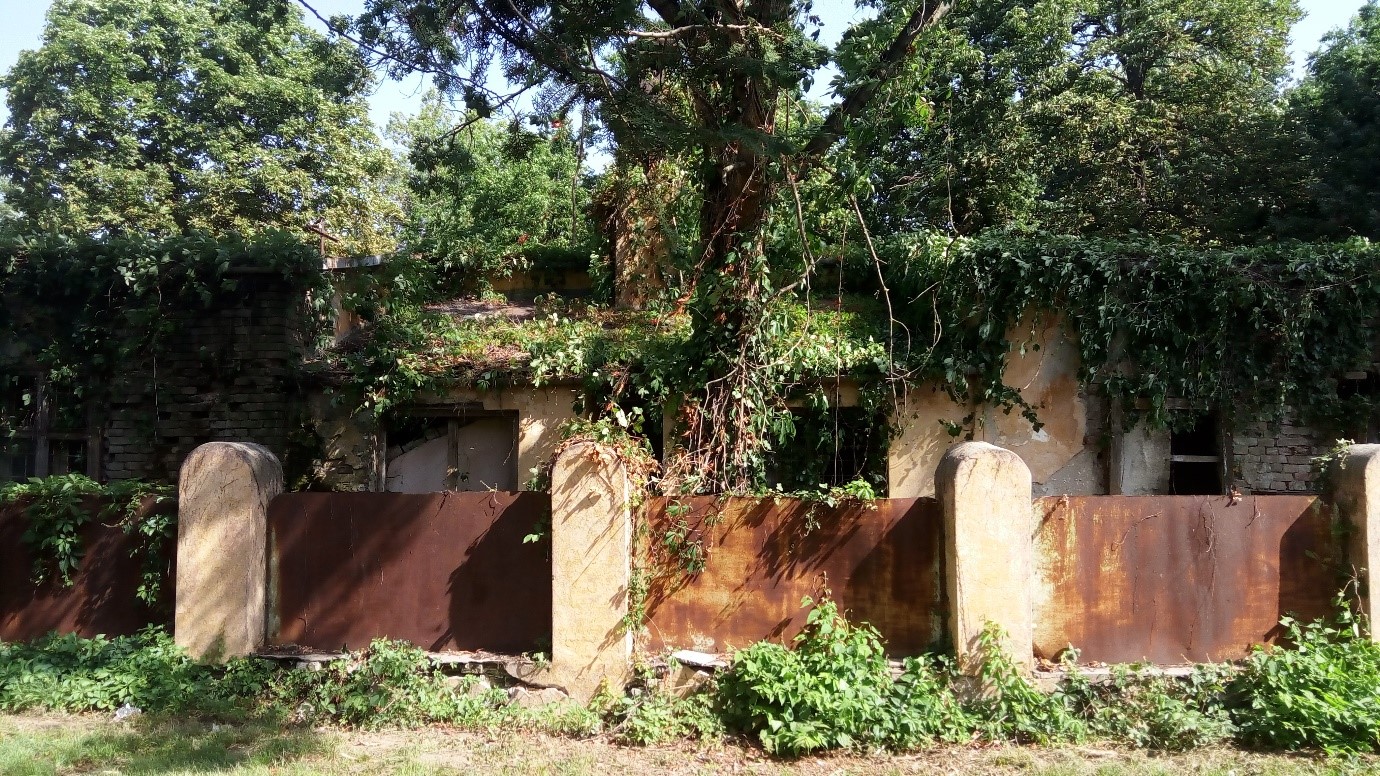
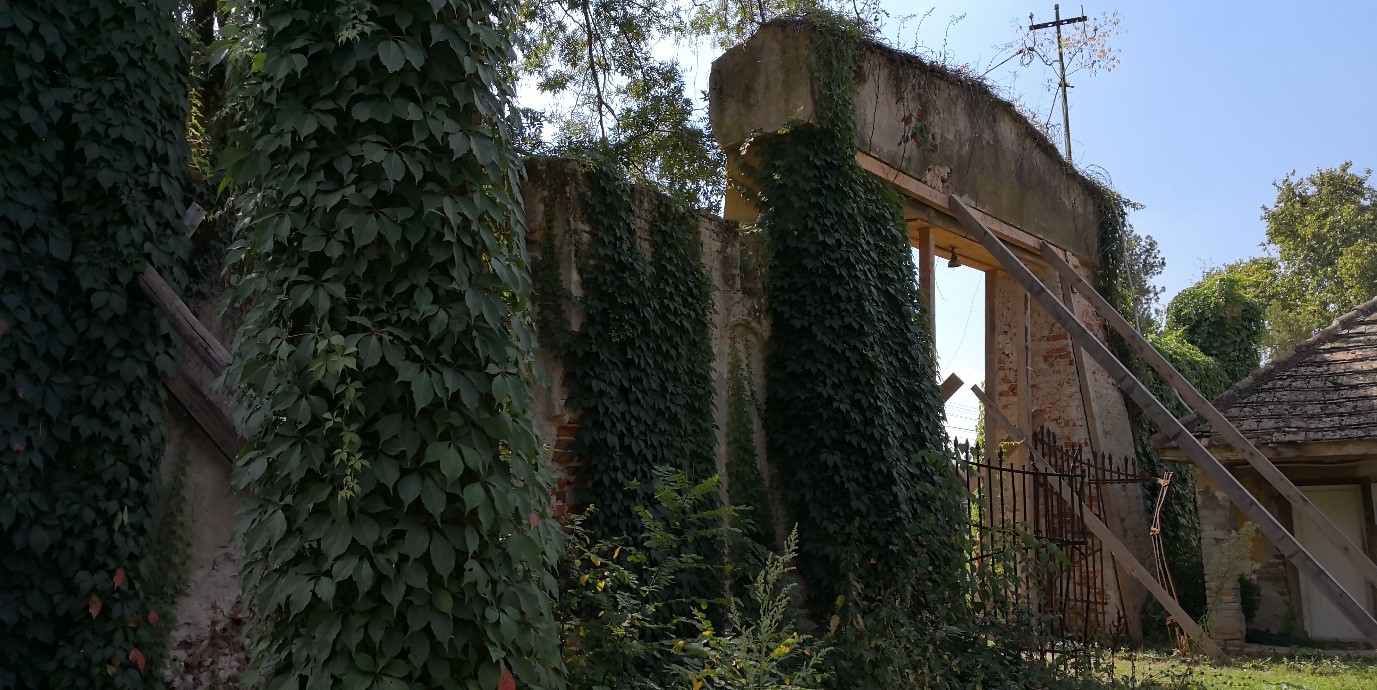
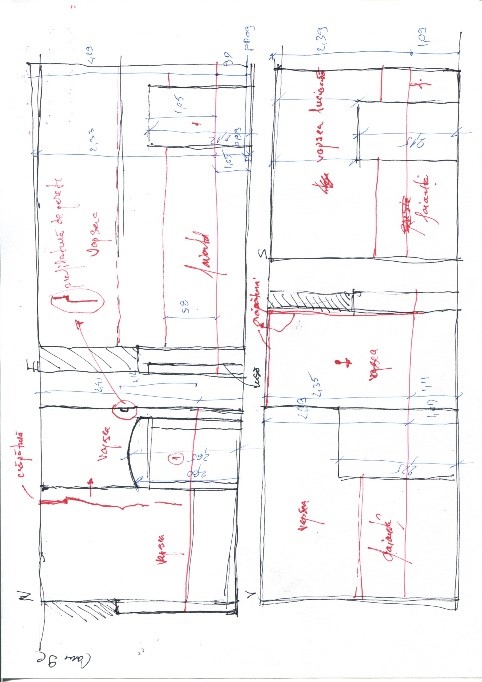
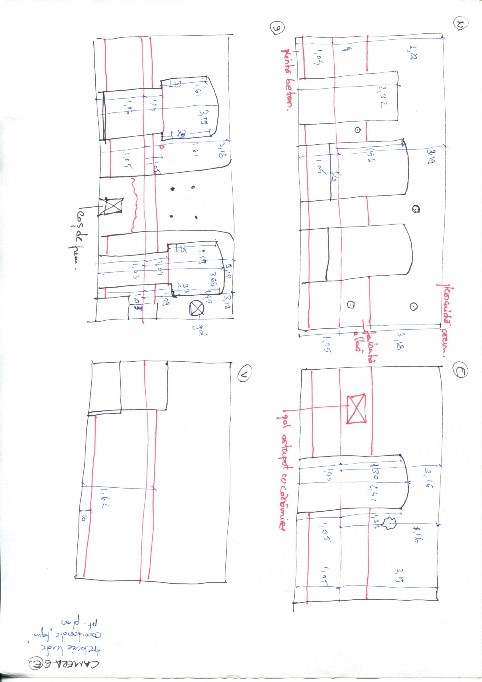
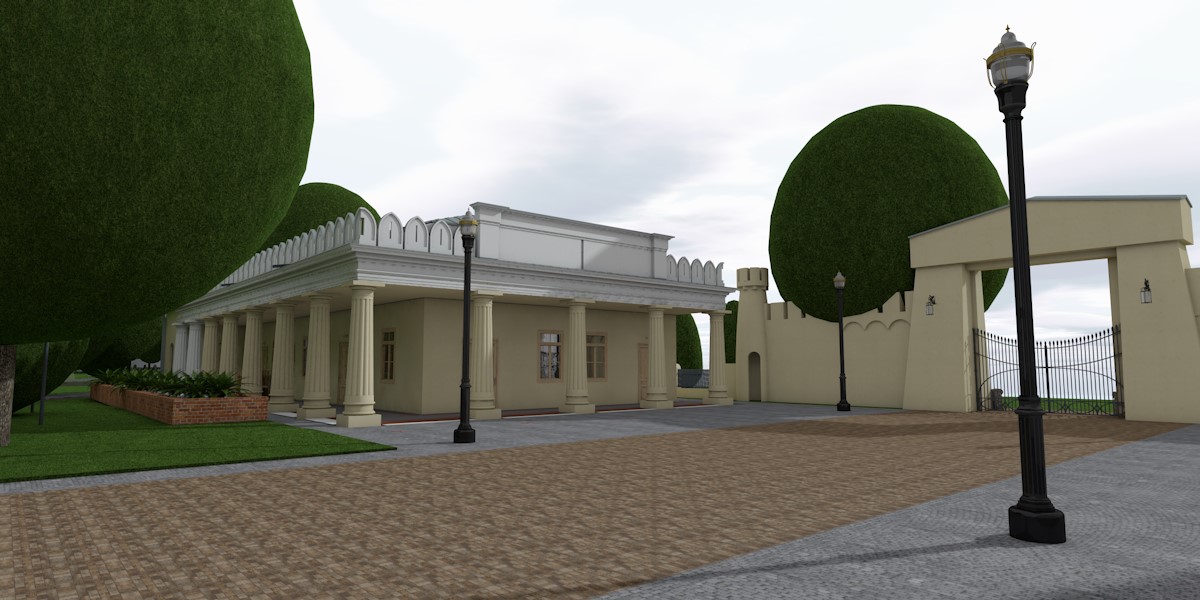
Within this park, one of the historic buildings that has survived for over 150 years and, passing through the hands of multiple owners who could not or did not want to maintain the building – Figure 14, is the Summer Kitchen (once an administrative pavilion and stable), serving the nearby Castle. The current owners of the domain – the Orthodox Metropolitan Church of Banat, desired to gradually resurrect the entire landscape and monuments, starting with the representative building of the Summer Kitchen. This fact generated the reason for which it was desired that in the initial phases, to achieve an extremely precise survey. The level of accuracy required was that of technical detail, the stage that will be reached as the project develops (Andreescu Ioan, 2014).
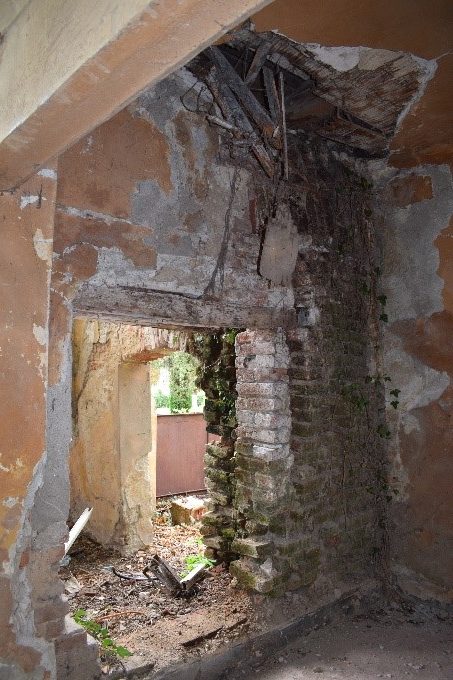
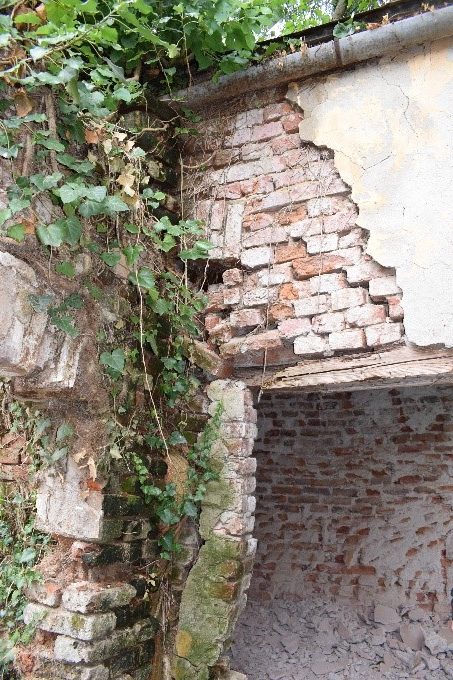
The fence is made of solid brick, while the gate (except the side towers) is composed of a structural core of debris (rubble, earth, brick debris and mortar) over which is applied on one side and another flat brick joined with mortar. A layer of plaster is applied over this brick. Above the gate is mounted a tin confection (originally it was tile).
The tower in the SE corner is made of solid brick. Following the survey and observations made on site, it could be seen that a tree grew in the contact area between the tower and the annex during the communist period – Figure 15.
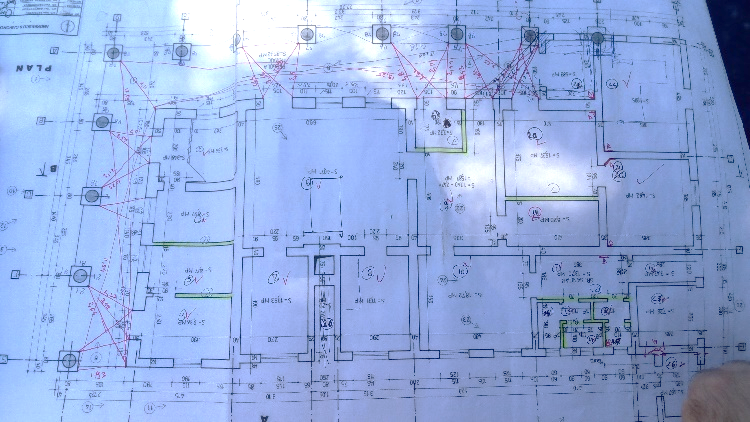
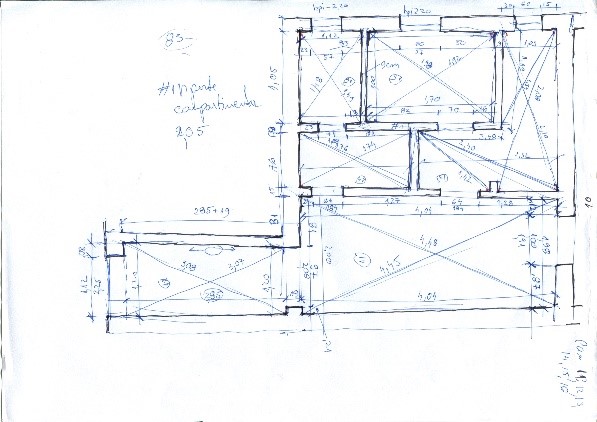
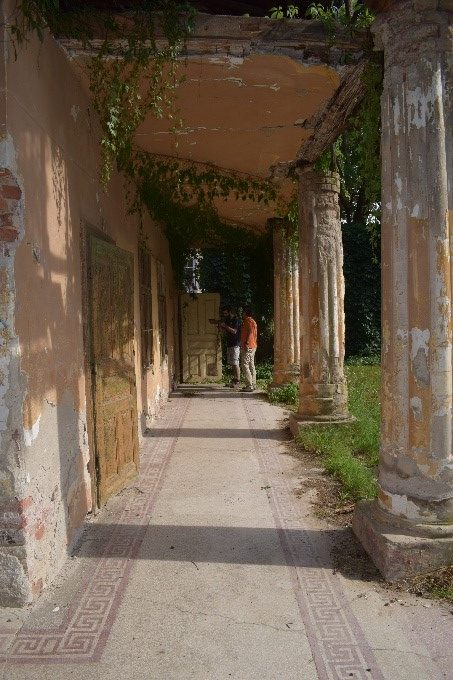
Being a professional project, the survey requirements are the highest. Accessible tools, on the other hand, have been limited. However, by approaching the problem with a clear mind (and a lot of triangulations – Figure 16) very good results can be obtained:
-
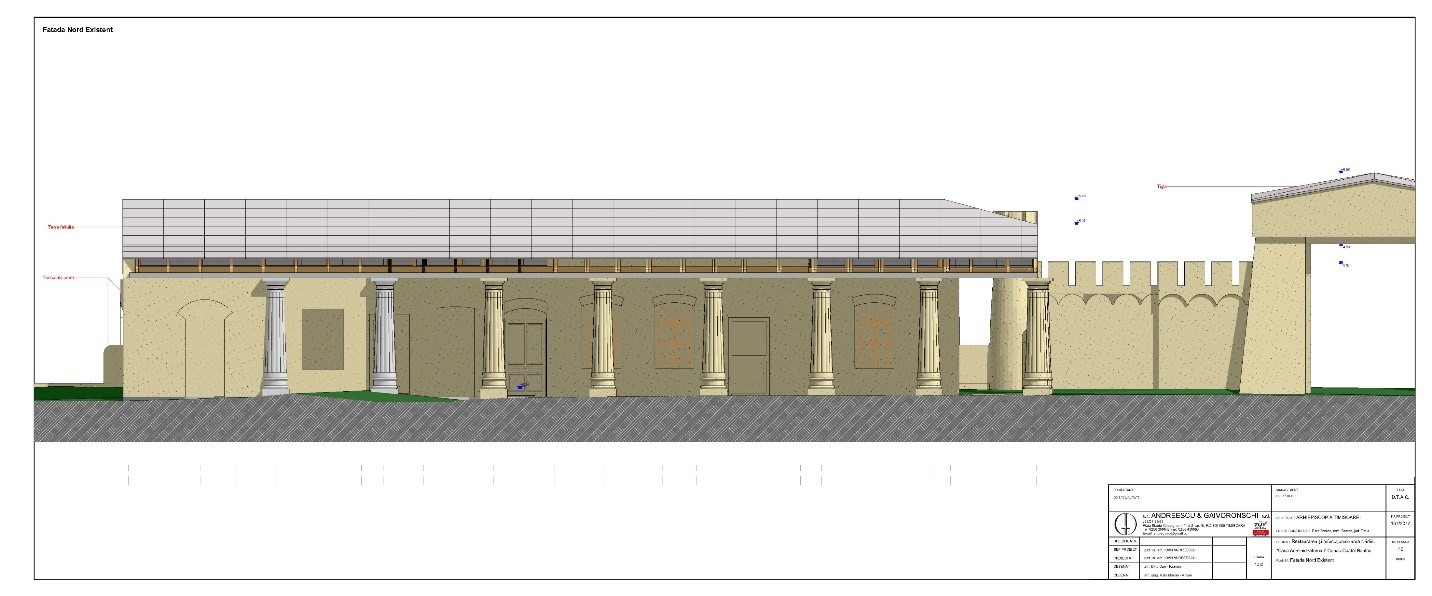
- The starting point was a topographic elevation of the main building, which included not only its perimeter but also the elevations of the floors, floors, cornices and ridges, the position of each outer column and as many elevations inside, at the base perimeter of the rooms
- After this step, the internal measurements of the elevations were performed. A horizontal guideline level was established (also correlated with the topographic elevation) which was materialized throughout the building, both inside and outside, by using a laser level, chalk, and string. Compared to this horizontal plan controlled in absolute elevations, vertical elevations measurements were taken to determine the absolute dimensions of the floor and ceiling.
-
- The same process of survey by triangulation and determination of absolute vertical dimensions was used to measure all facades and roof
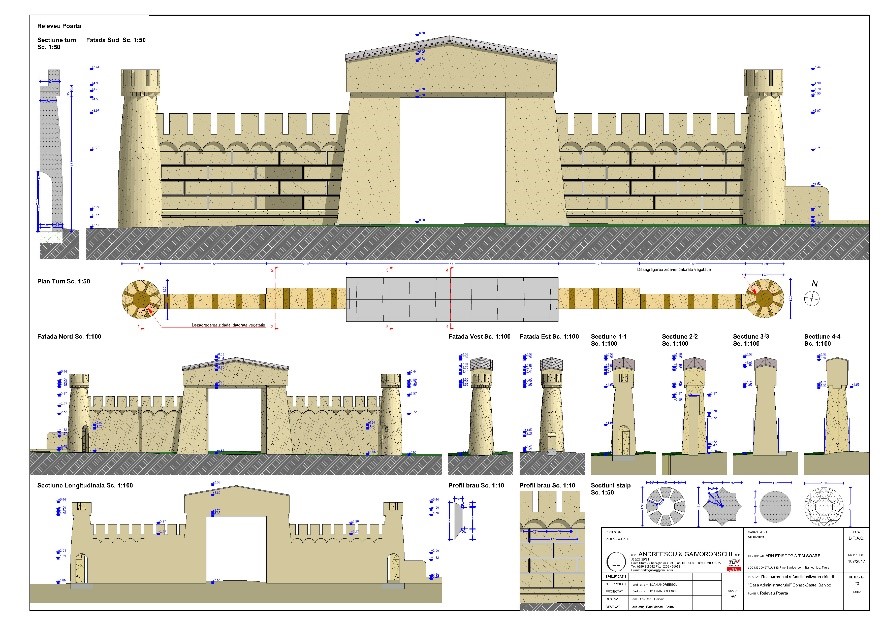
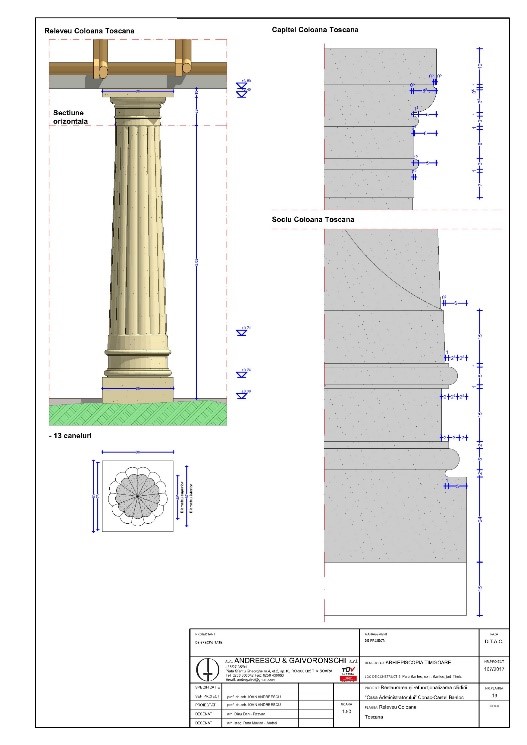
- A special case was that of the complex spatial elements, which presented challenges both in the survey stage and in the 3D modeling stage. The culprits are: composite columns, the ironworks that have been preserved (largely deformed and having missing elements), the main gate which has curved towers and battlements, but also of the difficult problem of revealing a roofing that went through a fire, several stages of repairs and partial replacements.
- The last stage of the survey process consisted in measuring the carpentry at the doors and windows, the mosaic pavement and the mapping of the degradations and the textures of the materials that were would to be reconstructed
- 3D modeling of the Pavilion, the main access gate and the adjacent fence involved a very large number of on-site correction visits, during a long summer in 2017
The complexity of the survey project was determined by the desired level of accuracy, not having access to more complex scanning techniques. The results obtained could lead to the level of technical design required by the project, but it involved considerable human effort and technical high technical knowledge of standard methods of surveying. Triangulation procedures and the use of a rangefinder, perspective restitution and profile measuring tools (profile duplicators) were used to measure the complex objects of the building. Currently, the problem of intervention in the entire historical park and the possibility of using photogrammetric scanning for the whole landscape and the historical buildings it contains is being considered.
Chapter 3.3 Testing the limits of standard-use architecture surveying methods
What can we learn from these examples, and the surveying methods that have been presented?
Each example has been carefully selected to present the different situations in which the readers of this course can find themselves during a heritage surveying project, as: students, MA, specialists in the field or professional architects. Each reader should draw their own conclusions based on current experience and future expectations. Never forget, that good theoretical knowledge must always be sustained by good technical knowledge, practice, and experience.
The purpose of this course is not to present the photogrammetric or laser scanning techniques as a panacea that can be used in any given situation, at any given time. Surveys represent a fundamental necessity within the patrimonial regeneration process. The current trends, due to the ongoing technological and digital evolution, produce solutions at a faster pace than professional can sometimes adapt.
Surveys have not always been constructed with digital tools, as discussed in Chapter 1. Standard surveying methods since the arrival of CAD (Computer Assisted Design) software (late 70’ and 80’) have been a cornerstone for architects, planners, and heritage conservation experts – Figure 20. Indeed, very satisfactory, and sometimes very good results can be obtained, as we have seen in Chapters 3.1-3.2. However, there are certain “pain-points” that have been previously described, that occur where CAD software fail short. These are the main limitations of standard detection methods:
-
- heritage buildings that contain decorative elements or sculptures that cannot be easily reproduced in 3D model, even if the measurements are generated by laser scanning – Franciscan Monastery from Arad Fortress
- restoration projects that require an extremely high degree of detail in order to obtain total control and complete sets of information of some buildings – Banloc Summer Kitchen
- very long measurement times
- human measurement or modeling errors that may be influenced by technological limitations and the detection method
- the quantity and quality of the information that can be obtained
- the additional costs that are generated by all these aspects
What alternatives can we choose if we desire to meet these contemporary and very demanding requirements?
Chapter 4. Photogrammetry and laser-scanning – innovative alternatives to standard methods
Today, contemporary digital surveying techniques have reached the point where three-dimensional models of high precision and detail can be produced in an astounding short time (Photogrammetric Applications for Cultural Heritage, 2017). Photogrammetry and point-cloud software have come to develop innovatively with remarkable results in the last 5 years. At the same time, the hardware processing capacity has doubled every 3 years. This fact currently allows the permits research projects, mapping, analysis, and promotion of broad categories of heritage sites all around the world.
Current scanning techniques can be divided into 2 major categories, each of which has advantages and disadvantages. On the positive side, these two techniques can be combined to obtain the best results.
Photogrammetry is the process by which a 3D model of an object can be generated, by interpolating the photos taken in-situ and introduced in specific photogrammetry software. Point-cloud scanning is based on the generation of a three-dimensional array of points that are defined by spatial coordinates, generated by the laser of a total station. If photogrammetry can generate better textured (colored) 3D surfaces (mesh), point-cloud scanning has the advantage of being extremely accurate.
Although photogrammetry as a digital tool has been used for relatively shorter time for commercial purposes, its concepts date back a few hundred years (Klinkenberg, 2008). Many artists and scientists have developed through the course of history, laws and principles that are now used in our area of interest (Gruner, 1977).
Photogrammetry is a complex process that involves several key steps in recording field data, processing photos taken, modeling and cleaning the final object for use in design programs. Depending on the complexity of the project, the processing times of the 3D model can increase exponentially, so the use of personal computers could not be feasible.
To best use these techniques (for architecture and connected fields), a specific set of core skills are required:
-
- Detailed knowledge of standard surveying technique – check Chapter 3
- Detailed knowledge of architecture design processes
- Intermediate Photography know-how and camera settings – for best results in data capturing stage
- Basic Photogrammetric software knowledge
- Intermediate 3D modelling software knowledge – to create optimized 3D models for viewing or design
- The ability to create useful digital outputs for the intended purpose of the survey
These are the minimum requirements for continuing with the applied part of the course, that is being described in the following Chapters.
Chapter 5. Digital Scanning Principles
Photogrammetry is used to map our environment and/or independent objects regardless of scale. Architects rely on precise measurements of buildings when working on restoration, conversion, or conservation projects. The more complex a building is the harder it is to create precise surveys and the longer it takes. In restoration projects it is general considered that buildings are never straight. The walls are not parallel to each other, the floors and the ceilings are slanted, every step of a stair cand have different dimensions and complex structures like roofs or detailed decorations are extremely difficult to measure using standard tools (see Chapter 3). However, standard practices and methodologies can be used for site surveying, but the people that are using them must be very experienced.
Photogrammetry is a very useful as a mapping tool that has begun to develop exponentially in the last 20 years and, together with laser scanning, have become the standard solutions for solving complex problems regarding the digitization of movable and immovable material heritage. The digitization processes of objects of any size (museum exhibits, buildings, and landscapes) represent one of the most promising methods of storage, visualization, interpretation but also interaction with the obtained data. Cultural heritage is beginning to become more and more accessible both to the general public, to researchers and professionals who aim to study, classify, preserve, communicate and restore these valuable elements of our identity (Fabrizio Ivan Apollonio, 2021).
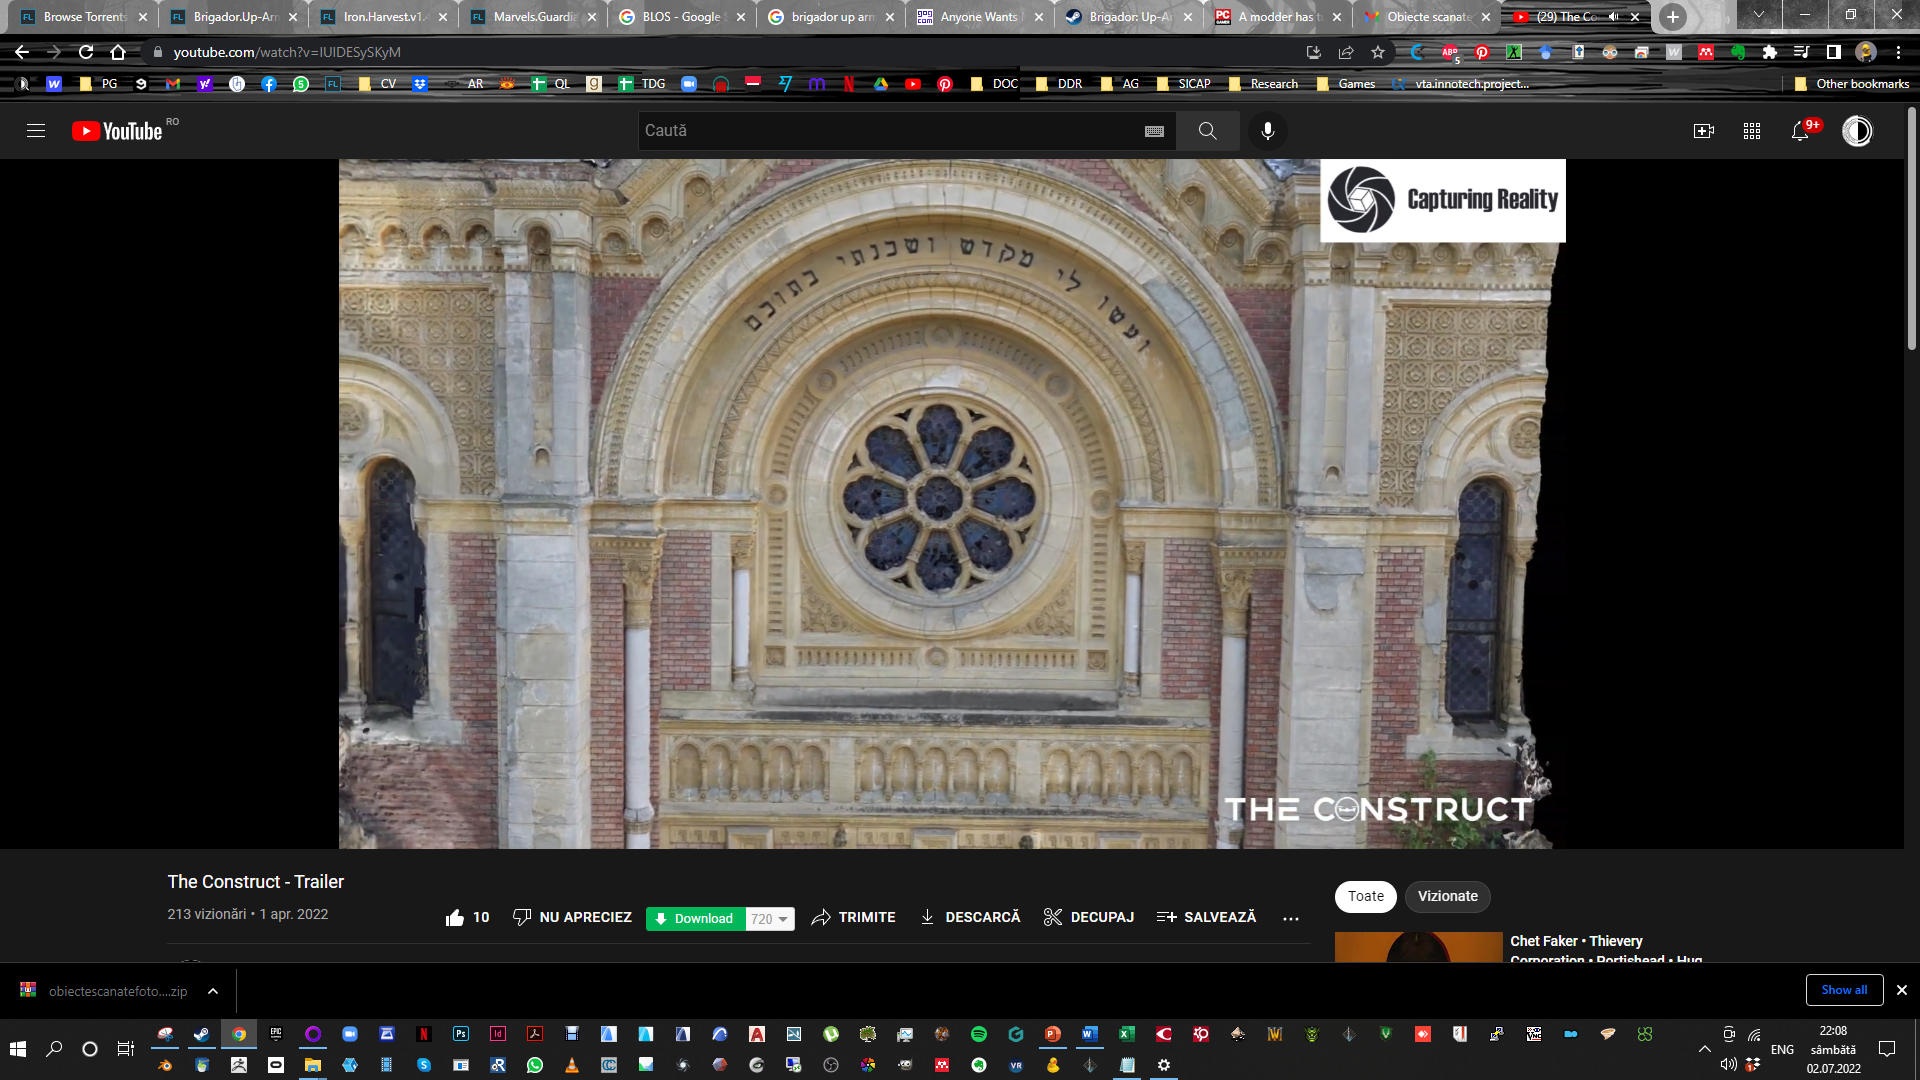
Restoration surveys are an essential stage of projects for mapping, data bases, and heritage restoration. The level of precision and detail to which these surveys often have very high requirements. A survey with standard methods of measurement and representation for a small to medium-sized object such as the Evangelical Church of Apos is estimated (based on other similar design experiences) to take approximately 3-400 hours, to which will be added about as many hours for 3D modeling of the lens. Contemporary photogrammetry and point-cloud scans can significantly reduce processing times by 80-90% when using the correct techniques and existing technologies at full capacity.
A short, but not exhaustive, list of digital outputs that can be obtained by photogrammetric and laser scanning methods can be of use in the following fields of activity:]
-
- topographic maps
- surveys in the field of architecture and heritage regeneration
- museum collections
- reverse engineering
- production and manufacturing
- digital fabrication / 3D printing – See Triplex Confinium Course O1.M3.03.02 – Digital fabrication for clay-based structures
- quality control / site surveying – Figure 22
- storage, visualization, and interpretation of movable and immovable cultural heritage – see Triplex Confinium – A collection of Pluridisciplinary Pedagogical Experiments and Field Research – Csito Castle Materials Re-use
- geology
The instruments used in photogrammetry have become very sophisticated. The more recent use of satellite photography, scan-from-motion technique, high quality and resolution photography, macrophotography, thermal and radiation scanning techniques, underwater photogrammetry scanning and much more together with dedicated software open new directions of exploration and research. Applied.
General aspects of Digital scanning procedure
Space is measured by a system of points that have 3 coordinates in space (on the x, y, z axes). By measuring the distance with a total station (automated rangefinder), the coordinates of the points are obtained, thus resulting a digital point-cloud. The points can create a complex mesh defined by triangles, resulting surfaces – the object mesh. The mesh surfaces can then be textured using a dedicated software (like Reality Capture) and using photos taken with a specific method. The final 3D model can then be exported in a file format of choice, for later use.
General scanning principles
Although photogrammetry and laser scanning use different physical and digital tools, there are some common guidelines that must be considered when using either one:
-
- Each technology has optimal working conditions – See Chapter 6
- The scanned object must be static – because the procedures represent a series automated triangulation and interpolation steps, trying to scan a moving object makes this task impossible
- The scanned object must be cleaned of all debris and vegetation wherever possible, for best results
- Some materials are harder/impossible to scan (metal, glass, water, leaves, vegetation, animals, fibers) – this is due to the way information is gathered and stored when using either photos or laser scanning
- When scanning an object, every step needs to be planned beforehand, repeating a step creates unnecessary costs
- Understanding the current limits of the technology and workflow which a linear process
Problems and challenges
Mapping procedures come with specific working conditions which must be considered if optimal results. Without going into too much technical details, the following conditions are considered essential when going through the data gathering phase:
-
- Meteorological and lighting problems: rain and wind (concerning drones), extreme temperatures (hot/cold), too much difference between shadow and light when taking pictures
- Faulty usage of technology or procedures may result in poor or unfavorable results – Figure 24
- When mapping buildings a site clean-up is necessary to remove debris, abundant vegetation which should also eliminate the lack of access in certain areas
Technical problems
Photogrammetry and laser scanning have a straightforward workflow. The difficulties appear when you want to obtain a specific result in specific working conditions. Some of the most technical issues are as follows:
-
- Wrong scanner setup (too many or too few points gathered)
- The lack of control points
- The PC or workstation is not powerful enough – digital mapping is a very hardware intensive process
- The accuracy of the 3D generated model is not scalable / you cannot estimate the final quality of the object without enough experience
Laser scanning principles (general scanning principles apply)
There are multiple types of laser scanners, ranging from solid-state scanners to LIDAR (Light Detection and Ranging) which are currently in use. A point-cloud of a scanned object or building is composed of multiple independent point-clouds that are generated from the position of a placed laser-scanner. These independent point-cloud can be either assembled in the scanner itself of through a manual or automatic process using dedicated software. The main aspects of laser scanning are:
-
- Choice of cloud-point scanner with or without colored point-cloud – some scanners have the option of taking color point-cloud through a process of coloring point when measuring a distance and position, through the use of an integrated camera
- The scanning station can be mobile or attached to a drone, and allows the generation of a coordinated point-cloud directly in the station
- Determining the maximum visibility positions of the object for the fixed scan station
- Control point are points that have the role of coordinating positions of individual point-clouds with each other and used for stitching the final point-cloud. Sometimes it is necessary to pin physical control point on site in order to simplify the stitching of point-cloud together
Main Laser Scanning Tools – Figure 25
-
- Topographic station
- Laser station – with different automation levels: topographic station, solid state scanner, 360o scanner, drone with laser scanning sensor, Boston Dynamics robot with a mounted laser scanner
- Performant Graphics station / supercomputer (increasing data processing and interpretation speed)
- Licensed software – while there exists open-source software like MeshLab, for complex projects, it is recommended to use more performant, paid software like Reality Capture (with PPI license – Pay Per Input) or Agisoft Metashape (perpetual license)
- Intermediate level Camera / video
- Graduated meter (for scaling purposes)
Laser-scanning Workflow – Figure 26:
-
- Determining the level of detail of the final object, the scanning area, and the analysis of the specific challenges on the site
- Scanning the object
- Information processing – coordination of point clouds on site or at the office
- Data extraction and point cloud decimation for easier use in modeling and design programs
- Mesh point cloud modeling
- (Re)Building the model into a design program (“re-modeling”) As-built – checking the final 3d model against the initial point cloud – we recommend the Faro Manual – “Getting started with As-Built for AutoCAD Software” which has multiple video tutorials for step-by-step instructions

Photogrammetry scanning principles (general scanning principles apply)
-
- The quality of the object depends very much on the quality of the pictures taken
- The number of pictures can increase exponentially the processing time
- The object must be “scanned” at a time of day when the light is constant
- Constant progress is being made in photogrammetry software and it is important to try to be always up to date to these changes because they can resolve some of the current technical problems
Main Photogrammetry Tools
-
- Minimum mid-level camera for high quality results
- Optional tripod
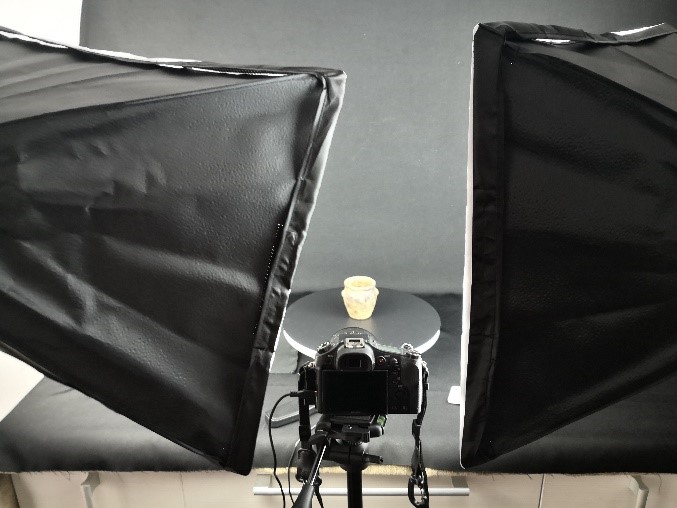
- For scanning objects: Blackbox studio (matte lights, turntable, full black or white background, etc.)
- Gimble drone with a high-quality sensor
- Supercomputer
- Sufficient Storage space
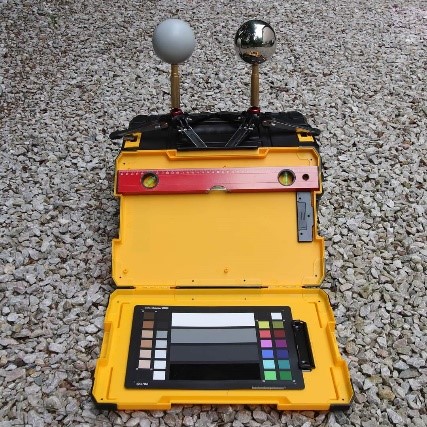
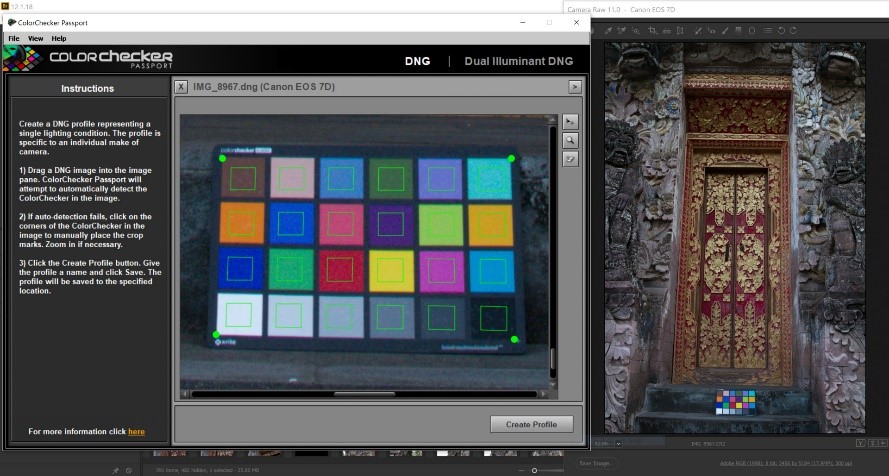
- Color Checker – Figure 27
Standard Photogrammetry Workflow – Figure 28
-
- Visiting the site and analyzing specific challenges
- Determining the desired level of detail of the final object
- Set object and neighborhood scan limits
- Defining the scan strategy (where to put the station, how to configure the drone path, at which moment of the day to take pictures)
- Data collection (complete photos – overview and details)
- Data collection in a photogrammetric processing software (Agisoft Metashape / Reality Capture)
- Picture alignment
- Creating masks (optional – for obtaining a more precise 3D model with less noise)
- Importing masks
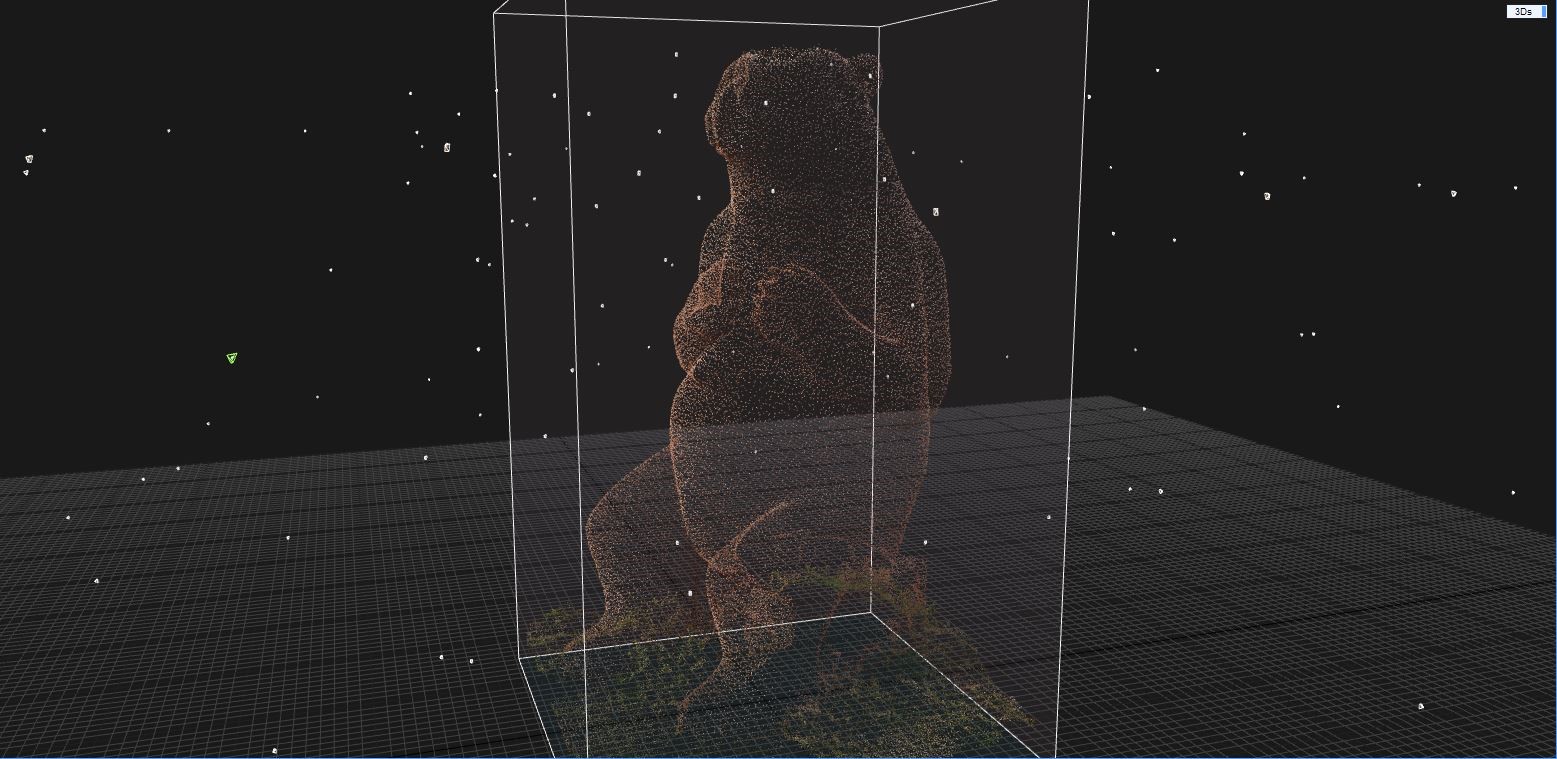
- Creating the sparse point cloud
- Point cloud optimization – creating the dense point-cloud
- Decimation
- Cleaning the point-cloud
- Creating and cleaning the mesh
- Creating desired texture maps (Color texture, Normal/Bump, Displacement, Reflection, Gloss/Roughness, Metalness; optional – AO/Ambient Occlusion, Albedo Texture, Fuzz Texture)
- Export 3D model in usable format

Figure 28 Basic Photogrammetry workflow: 1. Data Gathering – taking pictures, 2. Batch Photo editing 3. Importing in photogrammetry software, 4. Generate point-cloud, 5. Generate mesh, 6. Generate texture 7. Generate and visualize complex 3D model, 8. Reconstruct 3D model for design software and export, 9. As-Built verification
Chapter 5.1. Objects. Buildings. Landscapes
It is important to mention the problem of the scale of the object to be scanned. Although the principles mentioned above are universally valid, their use varies greatly in practice depending on the scale at which it is operated. The difficulty lies in the possibility of managing external factors (light conditions, weather, accessibility to the ideal points of visibility for the scanning tool). The control that a surveyor can have decreases proportionally to the size of the object being scanned. Therefore, additional measures must be taken to manage these problems.
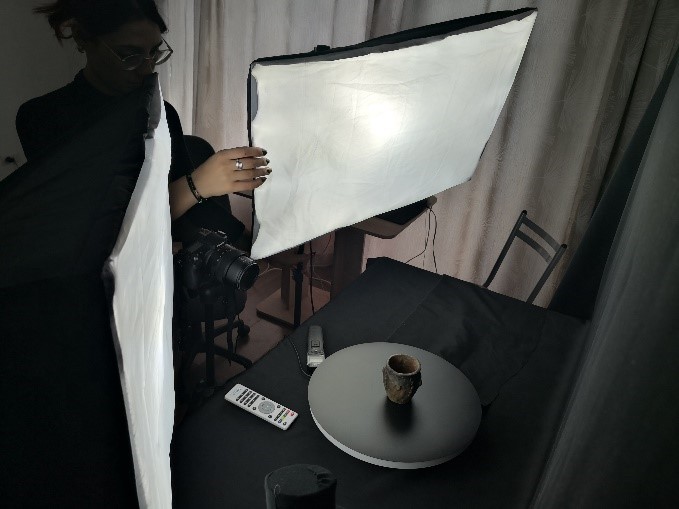
Small objects (no taller than a human) are ideal subjects because control of external factors can be complete – Figure 29. Small objects – such as museum exhibits, decorative architectural elements, sculptures, pieces of furniture; they have the great advantage that they can be introduced in a professional studio where all the external factors are eliminated, except the internal ones – generated by the general volume of the object, the texture and the transparent or glossy surfaces. Ensuring proper, uniform lighting and placing the object on a turntable and arranging a matte background are the key advantages that can be used.
Buildings, on the other hand, are another problem. First of all, due to the fact that the scan must be performed both inside and outside, and the scanning relationship between the surveyor and the scanned object is reversed. The surveyor, and his tools must move according to the geometric shape of the building and its rooms (where space is also concave). The problems related to the control of external factors are much higher, the planning of a scan must take into account the weather, lighting, duration of the gathering stage, the state of degradation of the object and the level of accessibility are a good part of the challenges of scanning these objects – Figure 30.
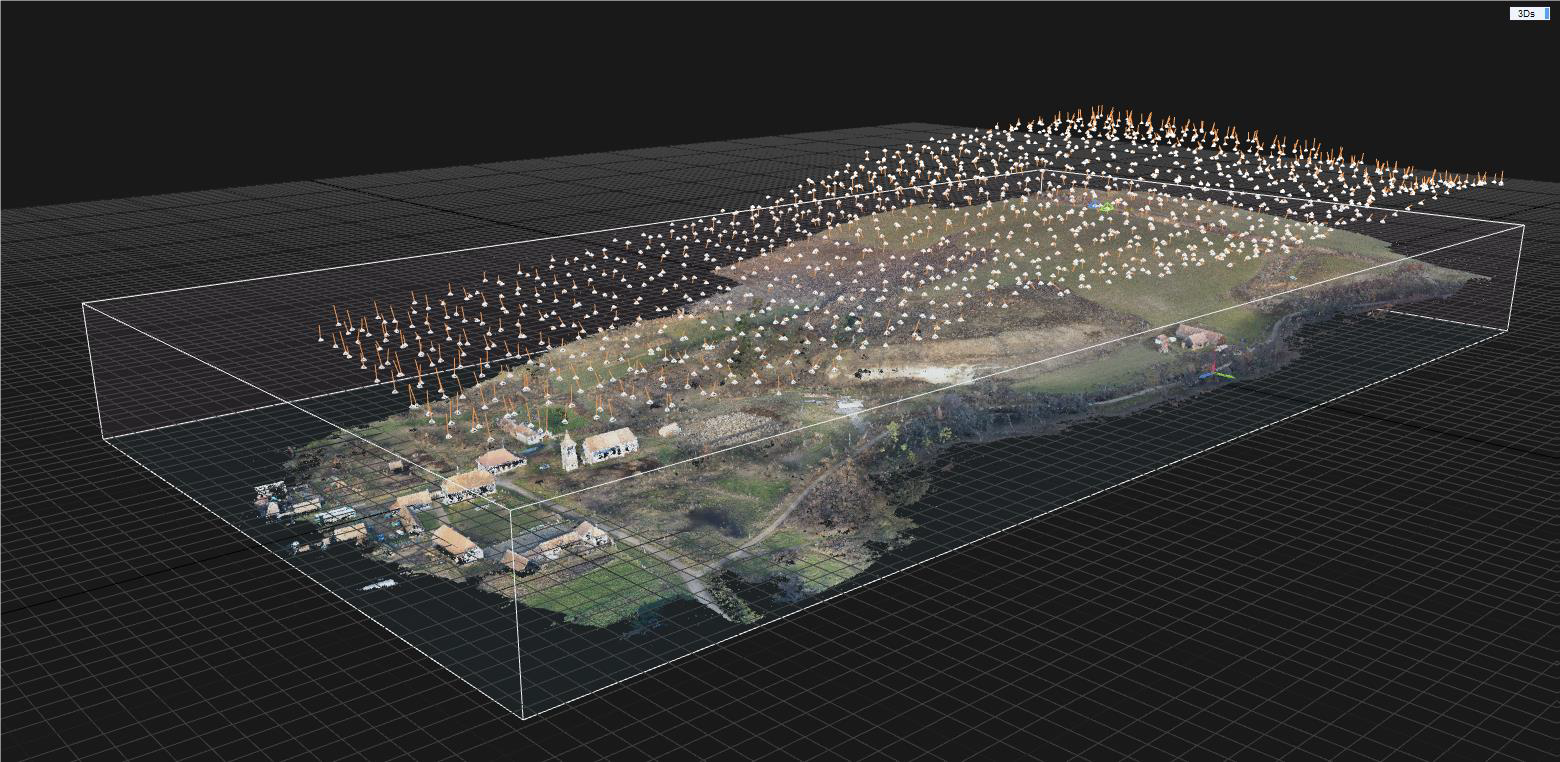
On an even larger scale, that of territory, the only possible method of scanning is the use of UVAs. Although some UAVs can be used without a pilot certificate, for larger projects, a scanning project cannot be envisioned in the absence of a more powerful drone. It is not feasible to scan large areas of land by taking pictures manually. Primarily because this method cannot provide adequate scan resolution (GSD) control. Secondly because some flight routes can only be made in BLOS (Beyond Line of Sight) conditions, where wi-fi control of the drone will be lost. There is also the issue of obtaining flight permits for drones when scanning in urban areas. Also, most countries have their own flight legislation which must be studies thoroughly.
Therefore, based on our own experience and others (Hill, 2005), a correct survey should meet at least the following fundamental requirements:
-
- the type of survey performed must be correlated with the purpose for which the information is collected. The way in which a given situation is addressed lead to choosing the right mapping procedure and tools.
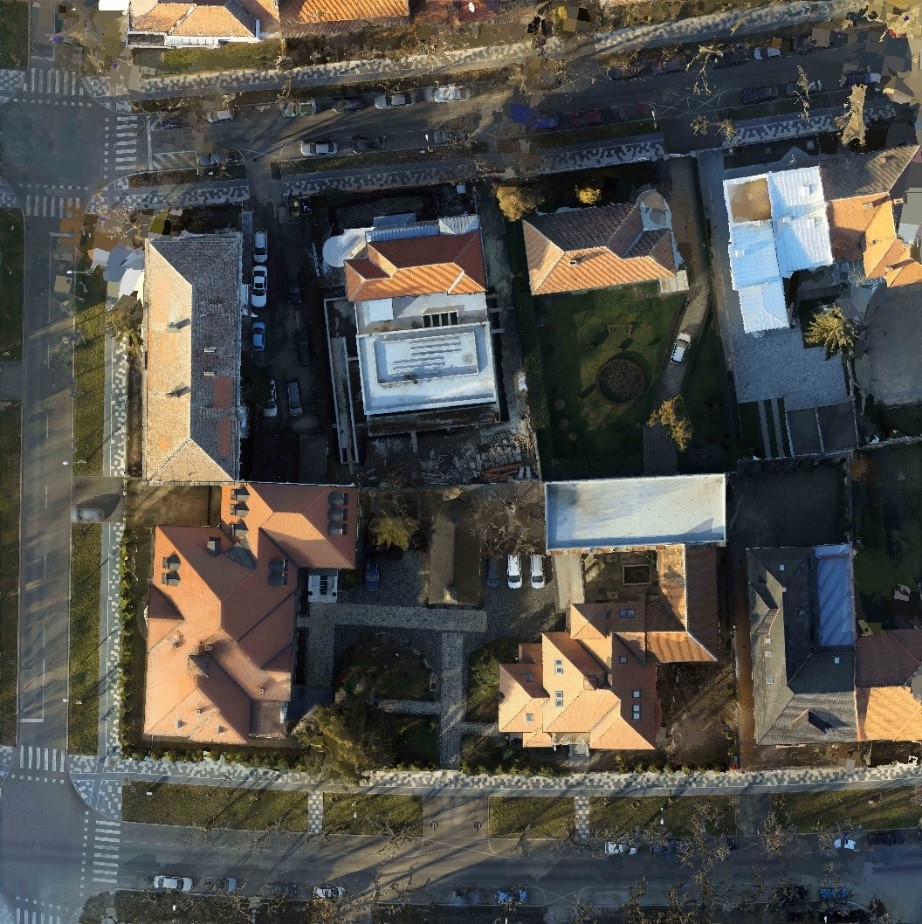
- the analysis of a building does not only imply its built volume. The area in which it is located, the nearby neighborhood, the surrounding landscape, also represent elements that must be considered when making a complete survey. This allows specialists to better understand the general context of which the object is part of.
- the survey stage is composed of two parts – a preliminary stage of measurements that are made in situ using appropriate equipment and procedures, and a second stage of reconstruction and remodeling based on the measurements. The digital output must be generated in a format that can be easily processed and viewed. These two sub-stages are often repeated in a survey due to the complexity of some buildings and since human errors that are inevitable if using standard tools to map complex structures.
- the survey involves not only volumetric, spatial, or field measurements, but also date of different categories. The surveys are always completed by databases of different categories, studies such as: photographic maps, chemical and physical compositions of materials, historical studies of the building or ensemble and archive studies, architectural typology, structural and geotechnical, carpentry, furniture and finishes, and the list can go on
- the information resulting from the use of different detection and mapping methods must be organized in order to be able to be correlated by specialists
All these criteria, and many others, contribute to better conservation and design solutions when dealing with building and site surveying (Paul Bryan, 2009). It is very important to understand that no matter the performance of the tools that are available, they are useful only insofar as they are used by competent specialists in accordance with the objectives set for the survey.
Take into consideration these aspects when planning your surveys
Chapter 6. Choosing the right tools for the right job
Theoretical knowledge is useful, but it is not enough if it is not supported by practical experiments as diverse as possible.
Where do we start?
The most accessible way get into the action is to download some photogrammetry applications on your phone and try to test them taking. while into account the information accumulated so far. Although a phone will never be able to replace the performance you can achieve with a professional camera, a graphics station and a high-performance drone, it has the great advantage of always being at hand. The applications on the phone allow you to see fast results, to test certain principles and, for a fee, to export as simple 3D models certain objects that you want to scan.
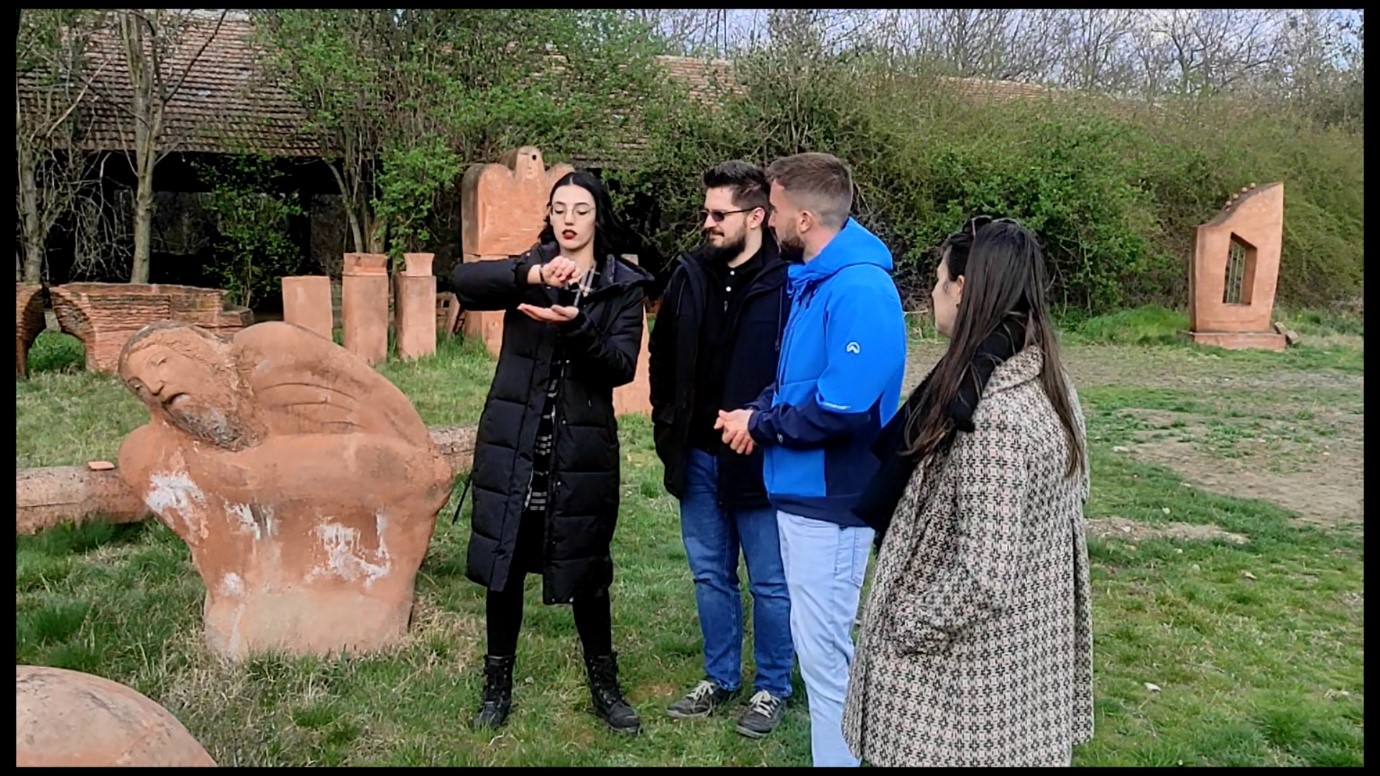
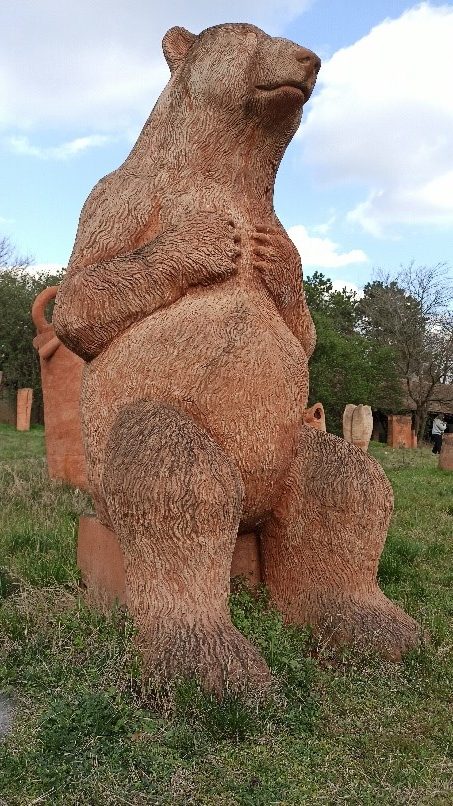
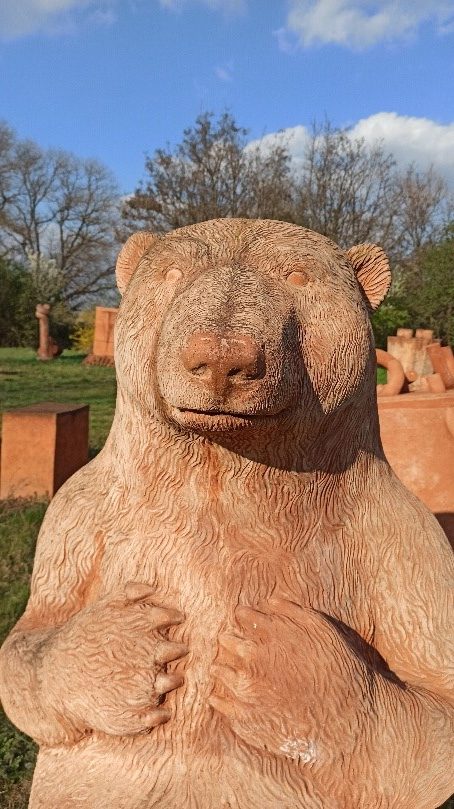
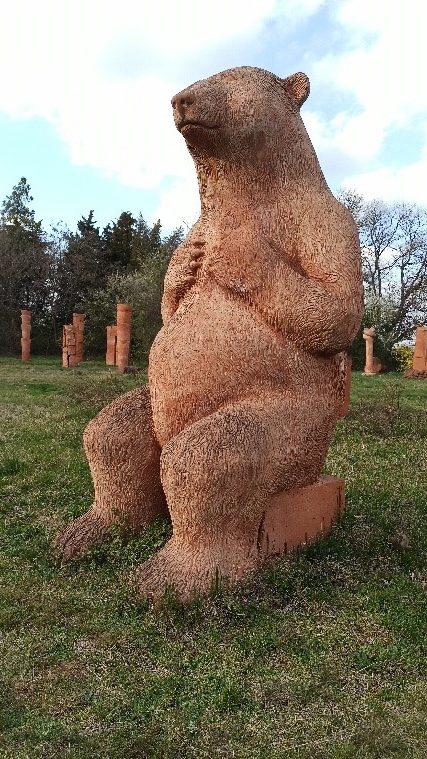
As an example of good practice, during the summer school in Kikinda, organized within the Triplex Confinium project, The Construct team organized a 3-day workshop in which 9 students from 3 countries (Serbia, Bulgaria, Romania) applied the knowledge acquired through this course. As a subject of study, the exterior exhibition of Terra Studio was chosen, consisting of ceramic sculptures – ideal objects for photogrammetry mapping – Figure 31.
Chapter 6.1. Phone applications
The main purpose of the workshop was to help students understand that photogrammetry is the scanning technique that uses photos to generate 3D models. Because there are phone apps that can be used to scan simple objects, we considered that it would be easier for students to try a hands-on approach before continuing with the more technical aspects of photogrammetry – Chapter 7.
Data gathering in photogrammetry is done by taking multiple photos at different angles with a high photo overlap of over 80% in order to get the best results. Some of the first challenges that appears is the general complexity and size of the object. Objects that are higher than the average human size tend to be more difficult to scan if one does not have good accessibility to the top of the object. Also, objects that have a lot of concave areas, or zones that you can’t take pictures of directly, tend to be difficult to photo capture.
The first experiment that anyone can do is to download some photogrammetry applications on their personal phone and choose their study subjects. Before downloading the applications and performing experiments with them, the following aspects should be taken into account:
-
- The phone used must have at least a medium level camera, otherwise there is a risk of not aligning the pictures
- Internet access is not mandatory, but may limit the performance of many applications. In some cases, the applications work only with constant internet access
- The phone must have enough storage space for data gathering and processing (if the application uses the phone’s hardware)
- During the experiments the principles mentioned in this course must be taken into account
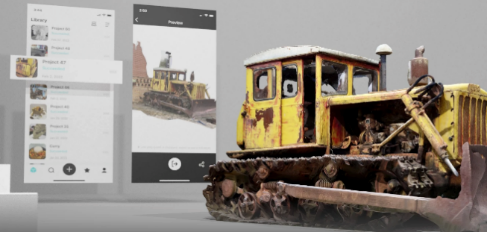
For newcomers, we recommend using 4 applications: Kiri Engine, 3D Scanner Pro, 3D Live Scanner, Scann 3D (PPI license) – Figure 32.
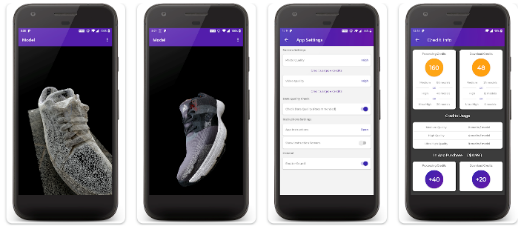
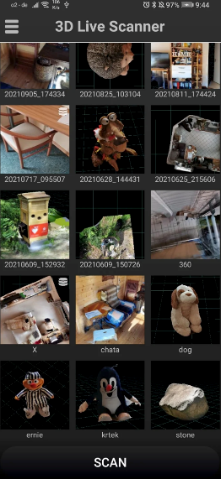
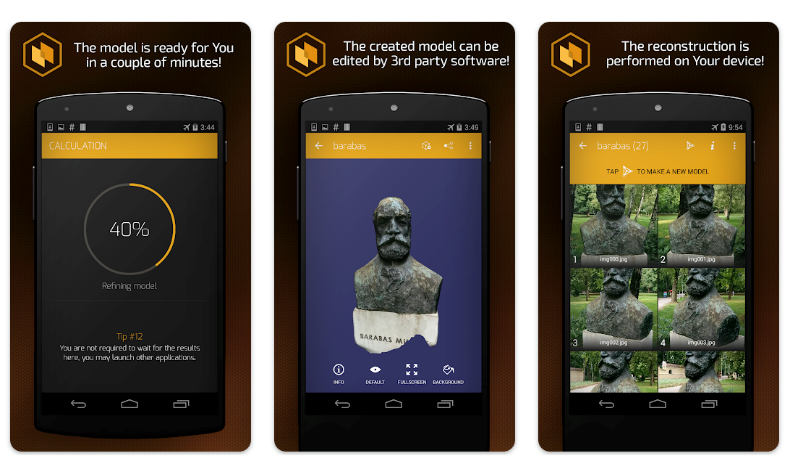
All the apps have different features and step-by-step tutorials on how to best use the phone camera and photogrammetry workflow on small-scale objects. Phone apps are also limited to a relatively small number of photos that can be taken (most of them have a limit of 70 photos per object). Therefore, complex objects can’t be easily scanned because it is difficult to ensure that you have an 80% photo overlap. Although you can use phone apps to scan objects, it is not ideal for use in more advanced applications. Most apps do not use the hardware of the phone in order to generate 3D models. They use on-line servers in which you can upload photos and the servers themselves generate the model through an algorithm. Unfortunately, most apps allow only a small number of parameters to be configured.
Try to do the following 2 experiments:
-
- choose one app and try to scan multiple objects
- choose one object and try to scan it with different apps
Compare the results with the following criteria:
-
- the level of detail of the 3D model
- time invested on scanning
- time invested on processing
- app special features – like exporting the file on .obj format and compatibility with other PC software
- quality of the in-built viewer
- total size of the resulting file – it may not seem important, but while scanning multiple objects, you can find yourself out of memory very fast
You will discover that some apps are working faster, some can create more detailed 3D models, while others can crash due to the fact that the phone’s hardware isn’t performant enough. This is not a problem because you are not expected to obtain perfect results. These experiments are only supposed to show you that photogrammetry is a very hardware demanding software, and you should always calibrate your objectives with the tools at your disposal.
Chapter 6.2. Personal computer, Graphic Station or Cloud Computing?
From our personal experience, nothing compares to access to a high-performance graphics station, when it comes to processing speed. Of course, access to such equipment also comes with high financial costs. Photogrammetry software allows the use at maximum capacity of the hardware on which the processing is done.
For beginners who want to understand how everything works, access to an expensive graphics station is not necessary. It is enough to use the personal computer that can support at least design programs in 3D architecture, and modeling, such as ArchiCAD, AutoCAD, ZBrush, 3D Studio Max. It is recommended that the minimum computer specifications meet the following requirements: 16 GB of RAM and an Nvidia CUDA-enabled GPU. Higher hardware reduces processing times and helps reduce the risk of software crashing.
Depending on how far you want to go with your personal experiments (in terms of the number of pictures you want to process and the level of detail you want the 3D model to reach), you will soon find out that your personal PC will not be sufficient. If this is the case, access to a graphics station is essential. Usually, the use of more than 2000 pictures for a project that generates a mid-level 3D model is the technical limit that can be reached with most personal PCs, before crashing. A professional graphics station can go far beyond these limitations.
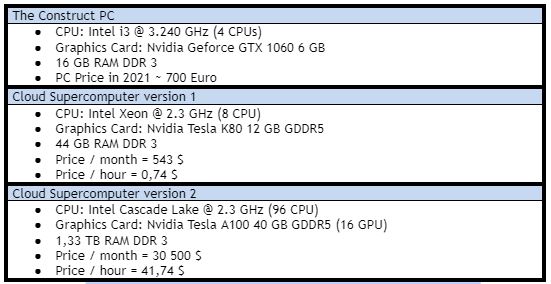
The highest level that can be reached with the processing power is the access to cloud-computing (like Amazon servers or Google Cloud) – the processing on cloud systems of photogrammetry projects. These can reduce the processing time by an order of magnitude compared to a graphics station. Instead, their use implies a very good knowledge of how to manage cloud server services, knowledge that is usually not available to architects or people who currently work in the field of heritage conservation. If PCs and graphics stations are a one-time investment, for cloud server services the costs are defined by hourly rates depending on the specifications of the configured server. Only in exceptional cases are the costs for the time gained justified. Table 1 shows the PC configurations that are currently used by The Construct team.
Chapter 7. Basic Photogrammetry workflow – a step-by-step tutorial
For the purpose of the next exercise, in order to better acquaint yourself with the photogrammetry workflow, you should install Reality Capture on your PC, and choose a small object to scan (not taller than yourself).
When using the photogrammetry workflow, it is best to use a specific set of guidelines. Figure 33 represent an almost ideal object for photogrammetry.
-
- Matte surfaces scan very well because they have a lot of features. Transparent, translucent or reflective surfaces give bad results because the object changes its surface when moving around it. One way to negate this problem is to cover the object with fine powder or special 3D scanning spray which can later be removed
- Featureless surfaces like a complete white drywall, plastic or some metal objects tend to have the same problem. In order to improve the results, you must find a (non-invasive and reversible) way to create features on the surface. Depending on the object that you want tot scan, some methods work, others must be avoided.
- When choosing a background for the object, it must have a sort of color contrast with the object. If choosing colored background, take care that background color does not reflect on the object.
- When working outdoors, try to scan in neutral lighting, in a cloudy day or in the shade.
- Having an 60-80% overlap of 70-100 photos is usually enough for one object. Taking more photos leads to better results, but the hardware used must be able to process the data.
- The object must be in focus and occupy most of the image space. Although you can move objects during the shoot, as long as the object is not deformable, it should not be a problem.
- Tripods and light-boxes can be used to enhance the scanning process
- Photogrammetry is a hardware-intensive process. Having an Nvidia powered CUDA GPU and 16 GB of RAM should be enough for entry-level projects.
Chapter 7.1. General Guidelines
The photogrammetry workflow is a three-step model (like any process in software engineering):
-
- Input
- Process
- Output
The input in any photogrammetry workflow consists of the source photos with optional laser scans or other data, like GPS information for each photo that will later help the software used, stitch the information together.
The processing phase can be done by any photogrammetry software.
The first phase of the output is generated by the photogrammetry software.
The next part of the output then is generated by any post-processing software.
Examples of photogrammetry software widely used today (alphabetical order):
-
- Autodesk Recap
- Agisoft Metashape
- AliceVision Meshroom
- Pix4D
- RealityCapture
- WebODM
Chapter 7.2. Data Gathering
As mentioned in the previous chapter, the Data Gathering phase is an input for the photogrammetry workflow.
It consists mainly in gathering (taking) photos, that will later be fed to the processing phase.
We can think of Figure 34 as consisting of 3 BIG processes each output of one is connected to the input of the next. (The Input element has the output which is fed to the Processing element, and the Processing element has an output which is fed to the input of the Output)

Working backwards from the Processing element’s input, we need to know the requirements. Hence, the Processing element has the following requirements which become the requirements for the prior node, the Data Processing node:
-
- Photos that were taken in such a way that they cover a certain surface area of the object being studied.
- The photos must be sharp, such that the software can find common points between each photo pair.
- Any blurry / distorted photo must be either further processed and the blurriness removed or the photo must be removed from the dataset to avoid needless processing.
- Overlapping area of the projection needs to be high, there is a trade-off between the area overlap between two photos (this translated to the whole project) and the time taken for the Processing phase. The higher the overlap, the better the quality of the final Output, but the higher the Processing time and memory. As a rule of thumb, anything between 40% and 80% overlap is enough (Marian Matys, 2021).
Sharp photos mean somewhat the same as in the intuitive sense: they represent reality as accurately as possible in the color and spatial projection representation of the studied object’s surface.
This translates roughly to the following in terms of digital photos:
-
- No smudges/blurriness (caused by camera shaking / object movement / insufficient depth of field)
- High mpixel camera (in current terms this translates to 10-20 MPixel cameras) – the more spatial information, the better the reconstruction of the final model. In the end, the only upper bound is defined by the Processing step.
- High (but not too high) overlap, as a rule of thumb anything between 40%-80% yields a high-quality object if all the other parameters are close to the ideal (Styliani Verykokou, 2020).
Chapter 7.3. Photo Alignment – generating the sparse point-cloud
Photo Alignment is the first part of the Processing step.
Having the input photos from the Data Processing step, the software used needs to determine the 3D cartesian coordinates of the sensor of the photos and the directed line segment with this origin that points to the center origin field of view of the camera taken at infinity. This, in turn, is related to the focal length of the lens.
The alignment is done by using algorithms like the computer vision SWIFT algorithm (Scale-Invariant Feature Transform) (Lindeberg, 2012) – which is a proprietary algorithm
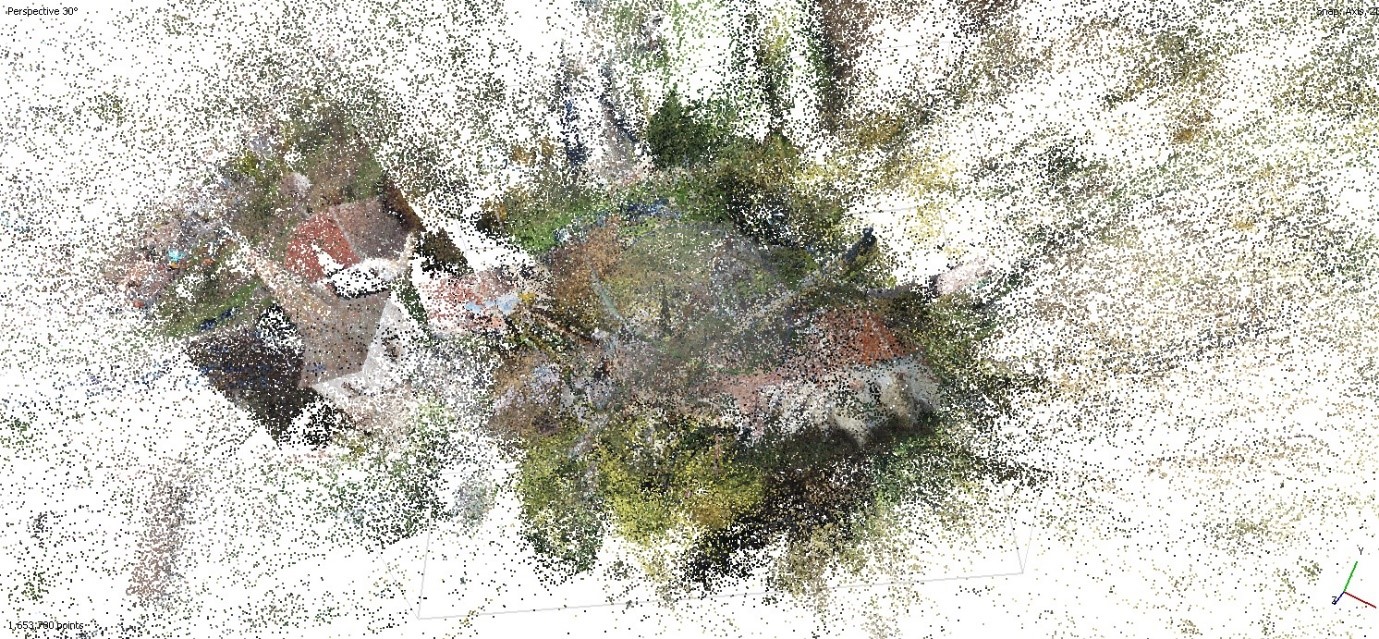
By applying a feature detection algorithm like the previously mentioned, the software will generate features, which are pieces of information that can be used computationally by the photogrammetry software in order to match between 2 photos and further compute the 3D cartesian information (Figure 35).
Chapter 7.4. Mesh Generation
After Photo Alignment, the next step in the Processing node is the Mesh Generation.
Here the aligned photos are projected 3D space and from this, a point cloud is created. The point cloud contains the 3D representation of the surface of the studied object, each point has a specific coordinate and a color. This step is very computationally intensive because the software needs to determine the locations of each of the voxels (point in 3D space) by a series of coordinates.
The steps required to extract point cloud data from a series of photographs are (David James, 2015):
-
- Feature recognition – each photograph is analyzed and key features which are invariant to scale and rotation that may be potentially used to align the photos. Generally, variations of the SIFT algorithm developed by D. G. Lowe is used. A mathematical description of each feature is made and stored.
- Feature matching – features have to be matched between photos. There are a range of algorithms available to perform this computation.
- Alignment of cameras – the coordinates of the cameras relative to each other and the recognized features is calculated by minimizing the error between distances on images and expected distances for all cameras. Minimization is usually performed using Levenberg-Marqardt algorithm and is collectively known as bundle adjustment.
- Construction of dense point cloud – once the cameras are aligned and distances between key features are known construction of the dense point cloud can begin. This step is the most computationally intensive
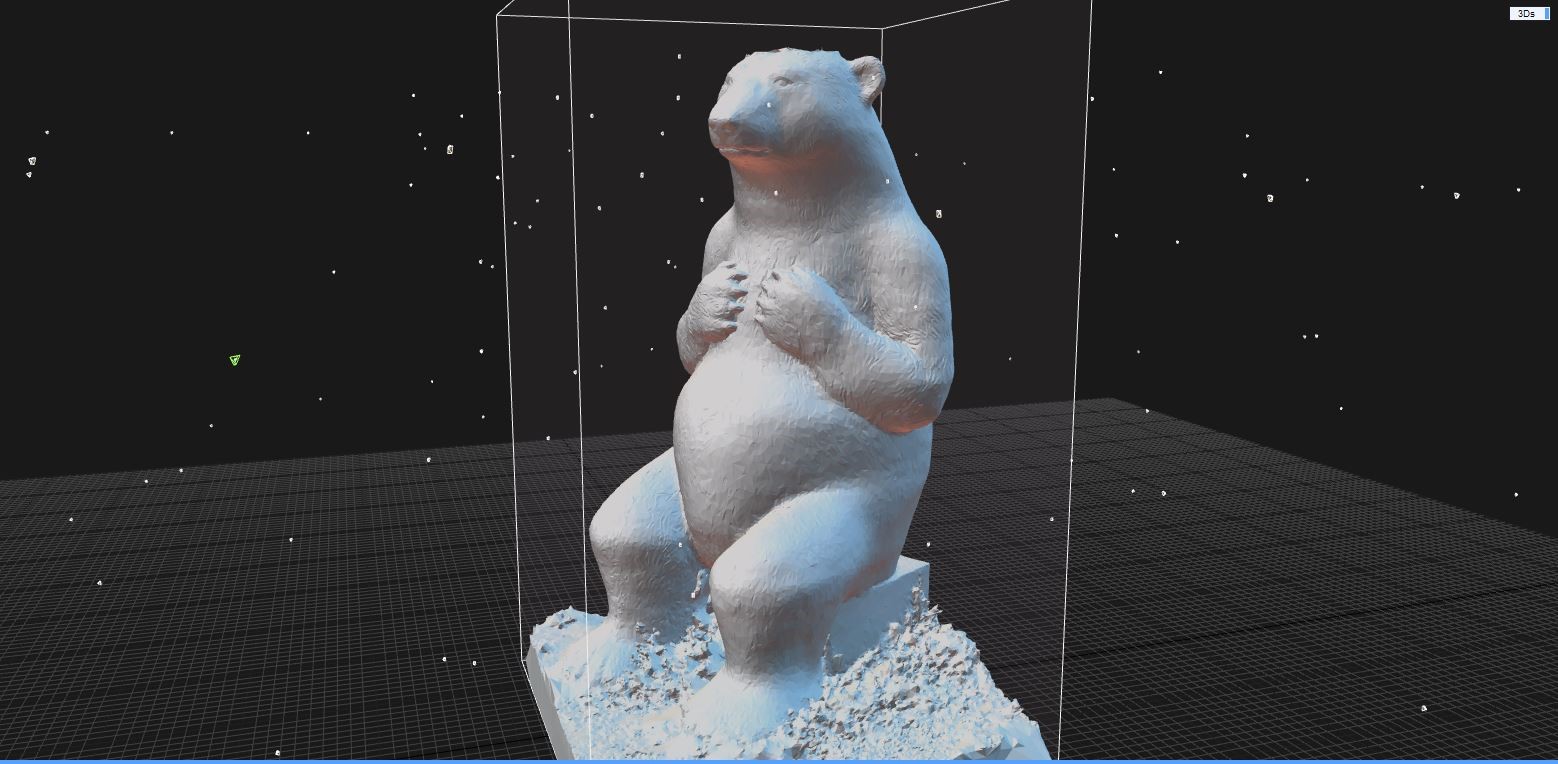
Once the point-cloud data is computed, the next step is creating the triangle mesh of the studied object (Figure 36), by using Delaunay triangulation (D. T. Lee, 1980). This step is also computationally expensive, because the most optimal algorithm known and used runs in O (n log n) time which is rather fast, compared to the input, but the n is high for large models (Leach, 1992).
Chapter 7.5. Texturing the 3D model
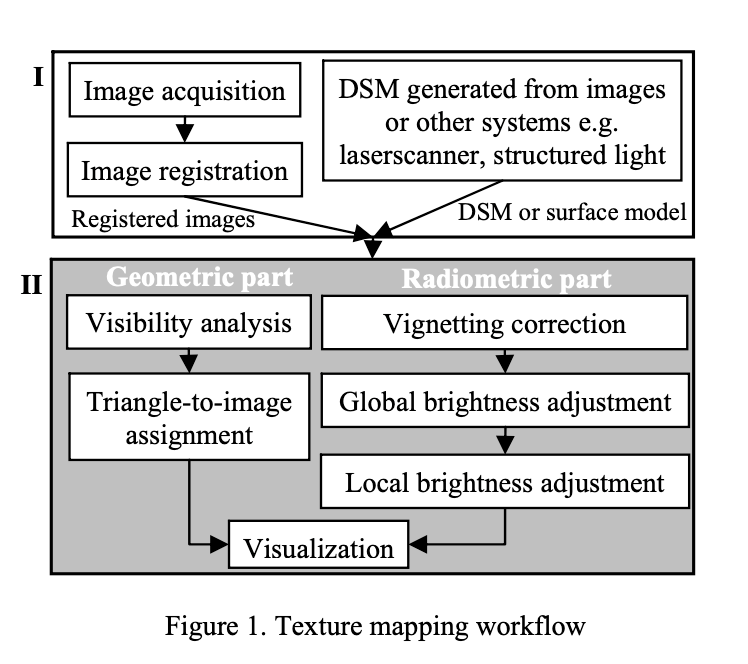
As pictured in Figure 37, once the DSM (digital surface model) which in our case is the triangle mesh obtained at the previous step is feeded into an algorithm to map the triangle to image and merge the corrected values of the brightness into the final texture of the triangle mesh (Hanusch, 2008).
What the texturing algorithm does is project the color of the photos in 3D space and depending on the rotation and direction of the camera, it projects the color extracted from the photos onto the surface of the triangle mesh, obtaining the final texture of the studied model.
Take into account that textures give the most information about the surface of the scanned object. This is especially important when dealing with heritage objects, regardless of scale.
Chapter 7.6. Exporting the file for further use
Exporting the textured or untextured triangle mesh (model) is a fairly straightforward operation. Depending on the supported file formats of the photogrammetry software, the software picks the correct format and exports either the 3D point information of the triangle mesh, along with the image texture, or the point cloud with or without color information.
For example, RealityCapture (CR, 2022) supports the following output formats:
- Sparse point clouds:
- XYZ File Format
- XYZRGB File Format
- Sparse point cloud as XYZ Point Cloud (*.xyz)
- Sparse point cloud as Wavefront obj (*.obj)
- Sparse point cloud as Polygon File Format (*.ply)
- Dense point clouds are exportable in either LAS or XYZ format.
- Meshes can be exported as:
- Wavefront obj (*.obj)
- Polygon File Format (*.ply)
- XYZ Point Cloud (*.xyz)
- Alembic (*.abc)
- Binary GL Transmission Format (*.glb)
- Stereolitography (*.stl)
- 3D Manufacturing Format (*.3mf)
- Laser Point Cloud (*.ptx)
- LAS Point Cloud (*.las)
- List of visible parts (*.partList)
- Autodesk’s file format (*.fbx)
- AutoCAD DXF (*.dxf)
- Collada DAE (*.dae)
Depending on your choice on design software that you want to use, you can find the compatible file extension, to import the 3D scanned model.
If you would like to check-out the result from the Kikinda Photogrammetry workshop, you can follow this Youtube link: www.youtube.com/watch?v=oUgDWt4R1NU&t=458s
Chapter 7.7. Web-based 3D model viewers
For viewing the exported 3D models, you cand choose either PC software that is dedicated for 3D modelling and viewing, or you can choose web-based 3D model viewers. The latter has the great advantage that it can be imbedded in the website of your choice.
There are two kinds of web-based viewers:
- Cloud hosted viewers
- Local browser storage viewers
Cloud hosted viewers:
Local browser storage viewers:
There is a twofold difference between the two proceedings: the cloud hosted viewers require cloud storage, and the models are accessible world-wide, and can support large models, the local browser viewers are accessible only in the browser that loaded the local 3D model, and can support only small models, because they are fully loaded in the RAM which makes large model viewing impractical on the usual desktop setup.
Most cloud model viewers require a paid membership for storing and distributing the model. Because of this, one needs to further optimize the model in order to reduce the size. The smaller the size, the smaller the cost of cloud storage and distribution.
Some of the cloud hosted viewers can render the meshes in 3D suitable for viewing in Virtual Reality (VR), for example, Sketchfab: https://sketchfab.com/virtual-reality
Special software is required for locally visualizing large 3D models, but software like RealityCapture or Agisoft Metashape can easily handle very large models, the only limitation when viewing meshes is the dedicated GPU card. The larger the GPU, the more it can render. When the mesh is too large, it will automatically switch to visualizing the dense point cloud instead, since that only requires CPU and doesn’t have a limitation on how big the model is.
Chapter 8. Preparing for the new paradigm
The ability to transfer physical objects into three-dimensional models at a hyper-realistic level of detail, through a fast and precise process, allows the construction of digital databases in an extremely easy way. Any major strategy for enhancing the heritage of a region (or a country) has, as a starting point, these databases through which information can be stored, accessed, analyzed, interpreted, viewed and put to good use.
A (short) list of research projects that can benefit from digital mapping techniques can contain the following areas of activity:
- Historical buildings in Cultural Landscapes
- Fortresses, fortifications and defensive systems
- Urban or rural buildings made in historical styles (Baroque, Secession, Art Deco, Art Nouveu, Modernism, etc.)
- Mansions, Castles, Parks and Landscapes
- Archaeological sites and museum exhibits
- Transnational collaborations between researchers
- Multidisciplinary approaches to complex heritage problems
- Providing a deep framework of interconnected and multi-layered databases (architecture, heritage, history, geography, anthropology, social studies, ecologic studies)
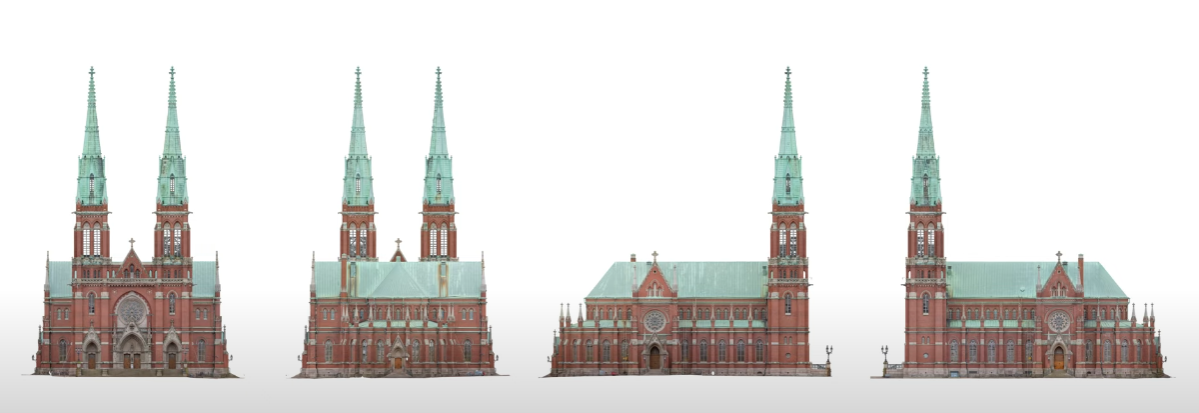
The emerging field of digital heritage mapping has managed to establish itself as a standard practice in countries and institutions that already have a vast culture and tradition in protecting and enhancing heritage (Figure 40). An extremely important factor that can be taken into account in the case of the research and development directions mentioned above, is the scalability of the project. We believe that these survey techniques can be applied on a very large scale, achieving in a short time multiple objectives that can be related to mapping and heritage assessment strategies. For example, if there are appropriate source materials for 100 projects / objects, all of them can be processed simultaneously. Photogrammetry, when paired with the right know-how, has the ability to process a large amount of documentary material at the same time, at the highest level of detail, in a fraction of the time required (<20%) for standard surveying methods.
Students, teachers, researchers, elected officials, administrators, stakeholders and local communities that can envision holistic strategies which can tackle complex territorial conditions are the main beneficiaries of this course. Considering that international practice of sharing knowledge between experts represents the key to which best-practice projects are developed and implemented, users of photogrammetry will come to play important roles in the nearby future. Cooperation and fine calibration of available physical, financial, human and intellectual resources can assure continuity in the on-going process of exploring and expanding the digital mapping procedures and vision.
References
- Andreescu Ioan, G. V. (2014). The Banloc Castle. The rebirth of a landscape Park. (G. A. F. M. Mazzolani, Ed.) PROHITECH – Protection of Historical Construction.
- Bachelard, G. (1971). The Poetics of Reverie. Boston, MA: Beacon Press.
- Ching, F. D. (1979). Architecture: Form, Space, & Order (Fourth Edition ed.). New Jersey: Wiley.
- CR, E. K. (2022). RC’s output / export file formats. Retrieved 07 03, 2022, from Capturing Reality Support: https://support.capturingreality.com/hc/en-us/articles/115001529012-RC-s-output-export-file-formats
- D.-R. (2018). Estetica Mânăstirii Franciscane din Cetatea Aradului – dissertation. Timișoara, Romania.
- T. Lee, B. J. (1980). Two algorithms for constructing a Delaunay triangulation. International Journal of Computer & Information Sciences, 219-242.
- David James, J. E. (2015). Point cloud data from Photogrammetry techniques to generate 3D Geometry. Proceedings of the 23rd UK Conference of the Association for Computational Mechanics in Engineering.
- Dinu, D. R. (2018). Estetica Mânăstirii Franciscane din Cetatea Aradului – dissertation. Timișoara, România.
- Dinu, D. R. (2018). The Baroque and the Franciscan Order. A dialectic relation. CoHeSION I – Conference on Heritage and Sustainable Innovation.
- Dinu, D. R. (2019). The Invisible Core. Arad’s Vauban Fortress. LIVENARCH VI – Livable Environments & Architecture.
- Dinu, D. R., Varga, L., Pasca Daciana, S., & Ostrovsca, I. (2021). Landscape Strategies for the Vauban Fortress of Arad. CoHeSION II – Conference on Heritage and Sustainable Innovation.
- Doyle, F. (1964). The Historical Development of Analytical Photogrammetry. Photogrammetric Engineering(XXX (2)), 259-265.
- Fabrizio Ivan Apollonio, F. F. (2021). A Photogrammetry-Based Workflow for the Accurate 3D Construction and Visualization of Museums Assets. Remote Sensing 13, 486.
- Gruner, H. (1977). Photogrammetry: 1776-1976. Photogrammetric Engineering and Remote Sensing(XXXVII (9)), 569-574.
- Hanusch, T. (2008). A NEW TEXTURE MAPPING ALGORITHM FOR PHOTOREALISTIC RECONSTRUCTION OF 3D OBJECTS. The International Archives of the Photogrammetry, Remote Sensing and Spatial Information Sciences.
- Hill, B. (2005). Undertaking historic building. Journal of Buildings Appraisal, 317-330.
- Institutul National al Patrimoniului. (2015). List of Historic Monument in Caras-Severin County. Ministry of Culture.
- Klinkenberg, B. (2008). History of Photogrammetry. The Center for Photogrammetric Training.
- Konecny, G. (1985). The international Society for photogrammetry and Remote Sensing – 75 Years Old, or 75 Years Young. Photogrammetric Engineering and Remote sensing(51 (7)), 919-933.
- Leach, G. (1992). Improving Worst-Case Optimal Delaunay Triangulation Algorithms. Royal Melbourne Institute of Technology, Australia.
- Lindeberg, T. (2012). Scale invariant feature transform. Computer Sciences Computer Vision and Robotics (Autonomous Systems).
- Marian Matys, M. K. (2021). Creating 3D models of transportation vehicles using photogrammetry. Transportation Research Procedia, 584-591.
- Mario Docci, E. C. (2017). Saper leggere l’architettura. Editori Laterza.
- Utrilla, C. M.-B. (2009). A palaeolithic map from 13,660 calBP: engraved stone blocks from the Late Magdalenian in Abauntz Cave (Navarra, Spain). Journal of Human Evolution, 99-111.
- Paul Bryan, B. B. (2009). Metric Survey Specifications for Cultural Heritage. English Heritage.
- Photogrammetric Applications for Cultural Heritage. (2017). Swindown, England.: Historic England.
- Smith, W. (2005). A Dictionary of Greek and Roman Biography and Mythology. Ann Arbor, MI: University of Michigan Library.
- Styliani Verykokou, S. S. (2020). A Comparative Analysis of Different Software Packages for 3D Modelling of Complex Geometries. EuroMed 2020: Digital Heritage. Progress in Cultural Heritage: Documentation, Preservation and Protection, 228-240.
- Thompson, M. (1966). Manual of Photogrammetry. Falls Church, VA: Americam Society of Photogrammetry.
- Zevi, B. (1948). Architecture as Space. Da Capo Press.
List of Figures
Figure 1 Fragment of a map of Rome, drawn by Giambattista Nolli in 1748 (Ching, 1979) 5
Figure 2 Graphical Analysis of a Survey (Parthenon, Athens) – a) Relationship between usable outdoor space and inaccessible indoor space b) Analysis of the structural system and construction techniques the structural system (Mario Docci, 2017) 5
Figure 3 Banloc Park Gate and fence – on site photo, courtyard view 2018 © S.C. ANDREESCU & GAIVORONSCHI S.R.L. 7
Figure 4 Banloc Park gate and fence – degradation survey © S.C. ANDREESCU & GAIVORONSCHI S.R.L. 7
Figure 5 Banloc Summer Kitchen and Gate 3D model reconstruction and proposal © S.C. ANDREESCU & GAIVORONSCHI S.R.L. 8
Figure 6 Banloc Summer Kitchen typological studies and framing © S.C. ANDREESCU & GAIVORONSCHI S.R.L. 8
Figure 7 The Vauban Fortress of Arad surrounded by the Mureș River and the city © S.C. ANDREESCU & GAIVORONSCHI S.R.L. 10
Figure 8 Franciscan Church main view from de Place de Armes original © Dinu Dan Răzvan 10
Figure 9 Tactical Field of the Fortress in relation to major City Landmarks © Faculty of Architecture and Urbanism of Timișoara 11
Figure 10 Exterior views of the rebuilt 3D model original © Dinu Dan Răzvan 12
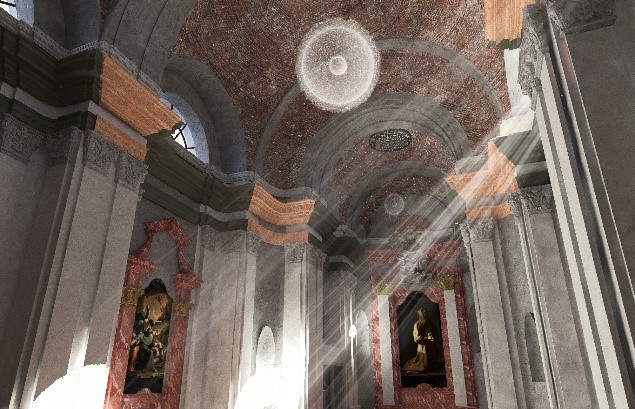
Figure 11 Franciscan Church interior views of the main hall and altars © SC STACONS SRL. 12
Figure 12 Main Facade 2D drawing superimposed over the ortho projection of the point-cloud © SC STACONS SRL. 13
Figure 13 Franciscan Church interior proposal a) longitudinal section; b) view towards the art installations 13
Figure 14 Banloc Summer Kitchen survey photo – overgrown south facade facing the access route © S.C. ANDREESCU & GAIVORONSCHI S.R.L. 13
Figure 15 Banloc Summer Kitchen survey photos a) exterior colonnade; b) interior elevation; c) in-grown tree betwen structural walls © S.C. ANDREESCU & GAIVORONSCHI S.R.L. 14
Figure 16 Banloc Summer Kitchen – building surveying: a) colonnade position; b) floor plan and vertical wall measurements © S.C. ANDREESCU & GAIVORONSCHI S.R.L. 14
Figure 17 Banloc Summer Kitchen – building surveying, interior elevations© S.C. ANDREESCU & GAIVORONSCHI S.R.L. 15
Figure 18 Banloc Summer Kitchen – 2D drawings of the 3D model: a) Composite column, b) Main Gate survey © S.C. ANDREESCU & GAIVORONSCHI S.R.L. 15
Figure 19 Banloc Summer Kitchen 2021 proposal © S.C. ANDREESCU & GAIVORONSCHI S.R.L. 16
Figure 20 ArchiCAD assisted Survey of Banloc Summer Kitchen © S.C. ANDREESCU & GAIVORONSCHI S.R.L. 17
Figure 21 Apoș Church, landscape context – 3D orthophoto plan generated by Reality Capture Software © The Construct 18
Figure 22 Restoration project and contemporary insertion on Art-Deco House, Timisoara, Romania – site surveying orthophoto plan © The Construct 19
Figure 23 Apoș Evangelic Church exterior photogrammetric mapping © The Construct 20
Figure 24 Apos Church photogrammetry scanning failed experiment due to multiple scanning sessions over the course of 3 days © The Construct 22
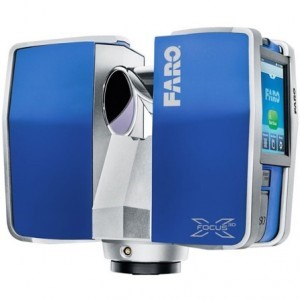
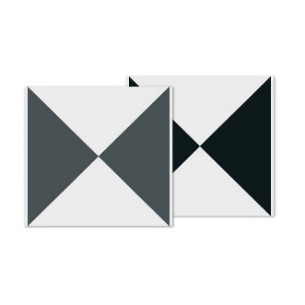
Figure 25 Faro total station, physical and digital control point 22
Figure 26 Laser Scanning workflow: 1. Scan, 2. Process, 3. Extract information, 4. Generate and visualize complex 3D model, 5. Reconstruct 3D model for design software and export, 6. As-Built verification 23
Figure 27 Color-checker usage on site 23
Figure 28 Basic Photogrammetry workflow: 1. Data Gathering – taking pictures, 2. Batch Photo editing 3. Importing in photogrammetry software, 4. Generate point-cloud, 5. Generate mesh, 6. Generate texture 7. Generate and visualize complex 3D model, 8. Reconstruct 3D model for design software and export, 9. As-Built verification 24
Figure 29 Photogrammetry Studio © The Construct 25
Figure 30 Fabric Synagogue of Timisoara, Main Facade survey experiment © The Construct 25
Figure 31 Providing technical support for on-site scanning experiments © The Construct 27
Figure 32 Photogrammetry Phone apps a) Kiri Engine, b) 3D Scanner Pro, c) 3D Live Scanner, d) Scann 3D 28
Figure 33 Sculpture by Davo Dukic – scanned by Milica Biorac 31
Figure 34 Photogrammetry workflow main processes: Input-Process-Output 32
Figure 35 Photo Alignment result in Reality Capture © The Construct 33
Figure 36 Mesh Generation result in Reality Capture © The Construct 34
Figure 37 Texture mapping workflow (Hanusch, 2008) 35
Figure 38 Final 3D textured model in Reality Capture © The Construct 35
Figure 39 Smithsonian web-based viewer with photogrammetric scanned object and guided tour © Smithsonian Museum 37
Figure 40 Finnish Photogrammetry Company Tietoa – 3D scanned St. John’s Church in Helsinki, reference for façade restoration project 38
Other Instructors

Ioan ANDREESCU
Professor
Cristian BLIDARIU
Associate Professor

Oana SIMIONESCU
Teaching Assistant

Ana BRANEA
Associate Professor

Mihai DANCIU
Teaching Assistant
Bogdan DEMETRESCU
Associate Professor
Bogdan ISOPESCU
Teaching Assistant

Ștefana BĂDESCU
Assistant Lecturer

Dan Răzvan DINU
Assistant Lecturer
Syllabus
The scope of the workshop is to introduce participants to the basics of photogrammetry mapping methods and its value in architecture design process, site surveying and heritage conservation. Photogrammetry and laser-scanning are on the cutting-edge of contemporary building and site-surveying methods. Although it has developed as a science for over 150 years, recent advancements in hardware processing power and user-friendly software development, have made it more accessible to professionals and enthusiasts alike. As this technology becomes more accessible, it enters professional and academic environments on a larger scale, resulting in new methods of creative use of a complex technologic process. We are standing on the edge on a wide-scale, emerging field. Having access to the right information at the right time, could give students and researchers a sharp edge in their respective area of practice.
O1.M2 OBJECTIVE AND SUBJECTIVE SKILLS IN INTERPRETING TERITORIAL NETWORKS
O1.M2.05. Digital Mapping – Current uses of Photogrammetry in architecture projects
Type of format
Lecture & Workshop
Duration
Session 1 – 270 min 60 min lecture (theoretical notions – Ch. 1, Ch. 2) 10 min break 90 min lecture (theoretical notions – Ch. 3) 20 min break 90 min lecture (theoretical notions – Ch. 4) Session 2 – 270 min 120 min lecture (theoretical notions – Ch. 5) 30 min break 120 min lecture (case-study – Ch. 6) Session 3 – 270 min 80 min workshop (photogrammetry workflow application – Ch. 7) 15 min break 80 min workshop (photogrammetry workflow application – Ch. 7) 15 min break 80 min workshop (photogrammetry workflow application – Ch. 7) Session 4 – 140 min 80 min workshop (photogrammetry workflow application – Ch. 7) 20 min break 60 min lecture (theoretical notions – Ch. 8)
Possible connections (with other schools / presented topics)
UNS O1.UNS / Interpreting and working on Heritage objects in their landscape
Main purpose & objectives
The main purpose of this course is to describe the more recent practice of photogrammetry in the design process of architecture development, site surveying and heritage preservation for applied practice in their respective fields. The holistic understanding and creative use of this method will permit students to have more angles of approach when managing complex buildings sites and landscapes. The course is dedicated to a large audience, with or without any prior knowledge or specific professional experience in the field of architecture and digital mapping. Therefore, the course is centered around three objectives: Holistic approach to site surveying methods Applied knowledge of photogrammetry workflow Further use of photogrammetry
Skills acquired
In-depth knowledge of heritage surveying methods Basic understanding of digital mapping principles Detailed knowledge on photogrammetry data capture workflow The ability to plan and execute a digital mapping process on small-scale objects
Contents and teaching methods
1. Architecture as spatial art and science Teaching method: lecture 2. The role of surveys in architecture design process Teaching method: lecture 3. Current practices in complex surveys (case-studies) 3.1 The Franciscan Church in Arad's Vauban Fortress 3.2 Banloc Park Summer Kitchen 3.3 Testing the limits of standard-use architecture surveying methods Teaching method: lecture 4. Photogrammetry and laser-scanning - innovative alternatives to standard methods Teaching method: lecture 5. Digital Scanning Principles 5.1. Objects. Buildings. Landscapes Teaching method: lecture 6. Choosing the right tools for the right job - a comparative study 6.1. Phone applications 6.2. Personal computer, Graphic Station or Cloud Computing? Teaching method: lecture, application, exemplification 7. Basic Photogrammetry workflow - a step-by-step tutorial 7.1. General Guidelines 7.2. Data Gathering 7.3. Photo Alignment - generating the sparse point-cloud 7.4. Mesh Generation 7.5. Texturing the 3D model 7.6. Exporting the file for further use 7.7. Web-based 3D model viewers Teaching method: application, exemplification 8. Preparing for the new paradigm Teaching method: lecture, debate
Reviews
Lorem Ipsn gravida nibh vel velit auctor aliquet. Aenean sollicitudin, lorem quis bibendum auci elit consequat ipsutis sem nibh id elit. Duis sed odio sit amet nibh vulputate cursus a sit amet mauris. Morbi accumsan ipsum velit. Nam nec tellus a odio tincidunt auctor a ornare odio. Sed non mauris vitae erat consequat auctor eu in elit.
Members
Lorem Ipsn gravida nibh vel velit auctor aliquet. Aenean sollicitudin, lorem quis bibendum auci elit consequat ipsutis sem nibh id elit. Duis sed odio sit amet nibh vulputate cursus a sit amet mauris. Morbi accumsan ipsum velit. Nam nec tellus a odio tincidunt auctor a ornare odio. Sed non mauris vitae erat consequat auctor eu in elit.